GarbageMan – Dumpster-diving the .NET heap
GarbageMan is a set of tools for analyzing .NET binaries through heap analysis
GarbageMan is a set of tools for analyzing .NET binaries through heap analysis.
These tools - researched and developed by Jarkko Turkulainen from W/Intel - offer the following benefits to malware researchers:
- Convenient GUI tool for intuitive access to .NET heap structures
- Ability to extract clear-text payload (PE Images etc.) from .NET heaps quickly,
- Easy analysis of encrypted network protocols, signs of data exfiltration, and similar,
- Ability to overcome malware anti-dumping techniques with a command-line tool called psnotify,
- Ability to analyze .NET heaps even in case of dynamic runtime loading from unmanaged code.
The techniques provided by the tools have been found to be extremely useful for malware analysis, especially when other approaches fail to produce results in a timely manner. The techniques also provide much deeper behavioral insights when compared with traditional dynamic analysis methods.
Code, and instructions for installing and setting up GarbageMan - researched and developed by W/Intel - are available from the WithSecure Labs GitHub: https://github.com/WithSecureLabs/GarbageMan
If you want to get right into using it, you may want to skip the following background information and jump into Basic Usage section of this writing.

Background
The .NET malware obfuscation ecosystem has gone wild during the last few years because:
- Microsoft released the complete .NET runtime and open sourced its compiler framework, enabling better research into offensive and defensive tools and techniques in the .NET space
- Some existing .NET research tools, such as de4dot and dnSpy, are showing their age.
.NET assemblies are very analysis friendly and offer the same level of convenience with regards to the development of obfuscations. This has resulted in more and more complex obfuscations and anti-analysis techniques. It is not uncommon to encounter unknown, modified, or entirely new obfuscators during day-to-day malware research work.
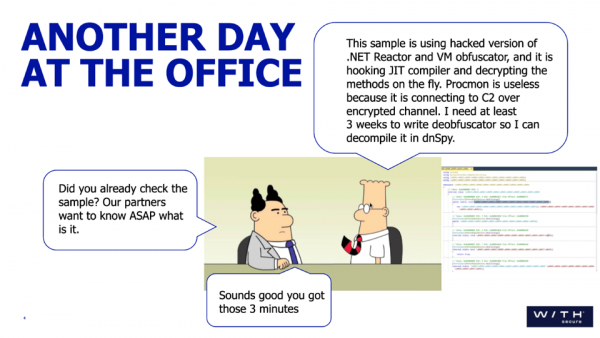
Some of the tricks .NET obfuscators are using for making the analysis harder:
- Many layers of droppers and protectors
- Process manipulations: hollowing, APC's, task schedulers etc
- Processes killing each other (watchdogs)
- Manual triggering of garbage collection.
Spending hours bypassing .NET obfuscations is often a waste of time for incident response teams and researchers. Instead of manually debugging and attempting to extract embedded payloads, it is possible to extract data straight from the .NET heap, thus drastically reducing the time spent on initial malware analysis.
Technical background and details
The theory behind GarbageMan relies on these basic assumptions:
- Any significant activity in the .NET CLR involves .NET objects in the managed heap
- Because of garbage collection, the .NET heap objects are accompanied by a rich metadata describing how objects are related to each other
- Everything in the .NET inherits from System.Object - thus also all primitive types exist in the heap.
If it were possible to step inside the heap and see all the objects and their interactions, it would be possible to understand quite precisely what the process is doing and it would work regardless of the load or injection method, encryptions or obfuscations.
The reason for this is very simple: in order to load additional encrypted payloads, the malware needs to decrypt these payloads, and the decrypted payload is just another byte array object in the heap.
In addition, the intermediate steps from encrypted to decrypted payload very likely involve some .NET objects, like I/O objects with related parameters like encryption algorithms and keys are present in the heap. By analyzing these objects and their connections to other objects, a coherent view of the behavioral state of the process could be obtained. And this is exactly what GarbageMan tries to accomplish.
Currently GarbageMan implementation is based on MS-provided library ClrMD. The library offers exactly the features needed for the job:
- Types and Values of .NET objects
- Object references
- Object member names and types/values/references to child objects
With the object references and other metadata, it is possible to arrange heap objects in a timeline, much like any other behavior analysis tool. This works because the .NET objects are allocated in order and there’s practically no fragmentation due to the garbage collection (that is, until of course the garbage collections happen – this is a feature of automatically managed heaps).
GarbageMan and the underlying ClrMD library offer the same type of functionality as some previous tools, like SOSEX and NETEXT windbg extensions, but hopefully as a more accessible and convenient GUI tool. It can be used standalone, or as .NET reversing "First Aid Kit", adding value to more traditional methods like network monitoring, process monitoring and memory strings. It features:
- Very easy to extract payloads like decrypted assemblies, archives, screenshots etc
- Can help in reverse engineering filesystem I/O, encrypted network connections etc
- Extremely useful if everything else fails.
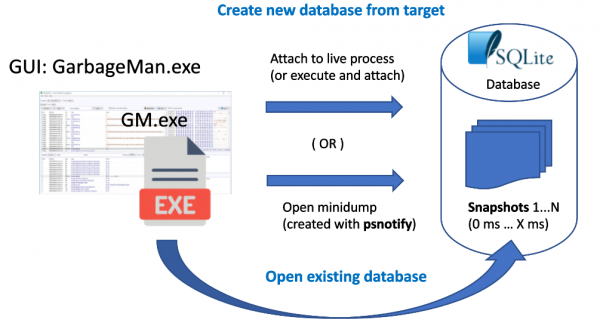
The basic concepts of GarbageMan are target, snapshot and database. Target refers to either running live process or user-mode minidump generated with any compatible tool like windbg or the psnotify (described below the diagram). The GUI tool uses command-line tool GM.exe for attaching to live process or opening a dump on disk and tries to locate and process .NET heap objects in the target. From these objects, it creates SQLite database for later fast access of the objects, and for storing session configuration. Heap objects are arranged into series of snapshots, which represent objects in a specific time. In the case of minidump target, there’s only one snapshot, from time the dump itself was created. In the case of live process, GM.exe can take snapshots periodically, for example every 300 milliseconds. This may be sometimes useful, for example, for a tracing process for very long periods of time. In most cases one snapshot is enough.
GarbageMan also relies on the underlying functionality of ClrMD in acquiring data from running processes or from minidump images. This can be very problematic with real-world malware. Typically, it is not possible to just execute a piece of malware and go on to dump the process memory. In many cases, the final payload is preceded by many levels of droppers, injectors and other tricks. That’s why we also developed a helper toolkit called psnotify, which features:
- Patching GC.Collect of all new .NET processes for preventing manual garbage collection
- Suspending and dumping .NET processes on exit for later heap analysis
It should be noted that psnotify cannot prevent the process of doing garbage collection internally, when the runtime thinks it’s time to clean up heaps. This typically happens every five minutes or so, depending on the available memory and other factors. That’s where the periodic snapshot feature might be handy. Note that psnotify creates minidump only on process exit, so you might still need to attach to live process in order to get the data. That’s mostly a concern of analyzing processes running for relatively long time (few minutes): if you just wait for psnotify minidump, it might not contain all the heap objects. This mechanism is especially very useful for catching short-lived droppers and injectors.
Basic usage
Starting up
When planning your analysis session, first you need to decide the strategy you are going to take for a particular piece of malware. A safe bet is to first run psnotify and then see what’s happening on the system. psnotify will dump all the intermediate malware stages and then it is up to you to take care of the final payload(s). You can wait for couple of minutes or then just use GarbageMan to create database from the running live payload process.
Alternatively, you can just execute the malware and use GarbageMan (or execute the malware using GarbageMan) for the final database. In this case you might miss any intermediate malware stages, and quite possibly also the final payload, if it quits fast.
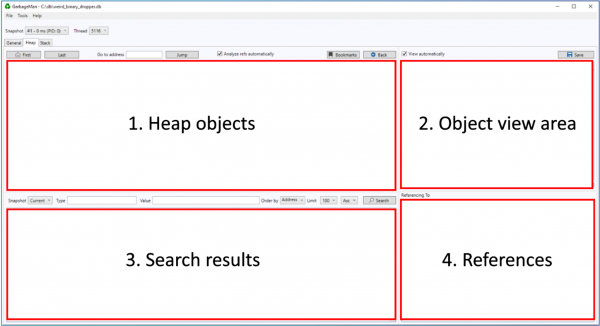
When GarbageMan starts, if first presents empty view like this:
Basic navigation
Initially, all the above views are empty. You need to either attach to a running program or minidump or open an existing database from the File menu. When the target is opened, its data is presented as follows:
- Heap objects. This is where the heap objects are listed, sorted by the heap memory address. There’s also object size, type and value
- Object view area. When an object is selected in the heap object view, its details are presented here as hex or as an image, if the data happens to be in recognized image format
- Search results. This area is initially empty and can be filled by either entering search items above the area, or then by selecting some search item from Tools menu. A very practical starting point is to run “Search all”. By double clicking an object in this area, you can jump into corresponding item in the heap object view
- References. If the heap object has direct references, they are presented here. Navigation works here the same way as in search view.
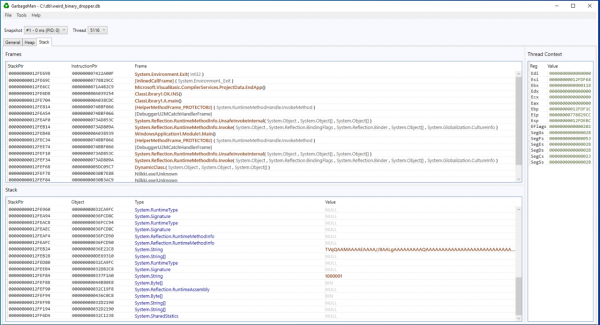
Stack view
In addition to heaps, GarbageMan also offers managed stack details, presented in the “Stack” tab. You can switch to different threads in process from above the stack frame view. Only .NET objects are presented in the stack slots. Thread context presents the state of CPU for selected thread.
One particularly interesting strategy would be to take multiple snapshots with a very small time, for example 50-100ms, and leave out heap objects from collection options (it will still collect objects in stack slots, and objects referenced by them). This results in more traditional behavior-based data collection, and it may be possible to collect rough API trace.
Object tracing
By selecting heap object and right-clicking, you can find some interesting tools from the context menu. One of such tools is object tracing tool. It tries to find objects by following references up to a specified depth (the default reference view offers only objects with direct references). With this tool it is possible to find interesting data related to various objects. For example, if you trace HttpWebRequest object, it is possible to find related data buffers, certificates, URLs etc.
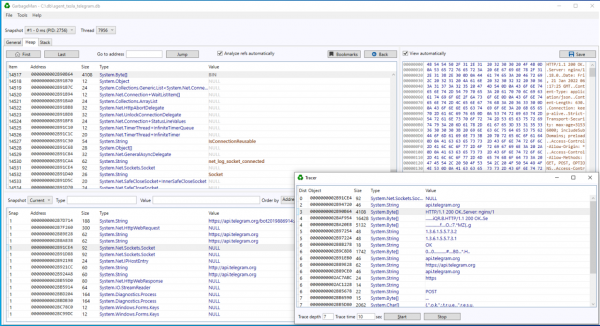
Also, the other way around works: from a string that looks like URL, you can trace objects related to that URL. In fact, most objects are related to all other objects, provided with enough trace depth. The default depth of seven is in practice a good starting point. Probably objects around a depth of 10 or so are not really related to a given object any more contextually.
Do also note that the trace tool can be very slow in case of large heaps (in the range of millions of objects). That’s why there’s a timer. In most cases the tool finds relevant objects in 10-15 seconds.
Object searching
Key functionality of GarbageMan is the ability to search objects from database and present them in the search area.
Search entries in the Search menu are built dynamically from JSON file Search.json. There are two types of search items: “basic” and “custom”. Basic types use directly the tools provided above the search area. There’s quite a lot one can do with them, but even more interesting is the custom search functionality. It uses raw SQL queries from the database. You can conveniently experiment with these queries with “Run raw SQL” tool, as presented below
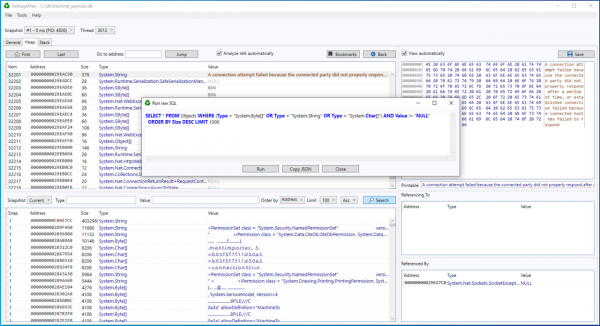
SQL query language is in fact a programming language on its own, so very complicated search queries can be built on top of it. You can see some examples in the example Search.json.
Once you are happy with the query, just export it as JSON and store it in Search.json. Then reload the database from the Tools menu.
“Search all” just executes all the available search items and sorts the result by the address, thus picking up only interesting objects and arranging them in a timeline that can be consumed instead of browsing through objects in the heap object list.
Psnotify
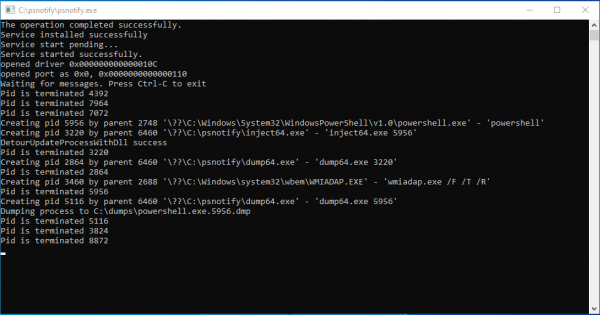
Psnotify needs to be installed to C:\psnotify (this cannot be changed, unless you modify it and recompile all the components). After this, just run psnotify.exe and it will take care of driver registration and starts to monitor the system. When done, stop it with Ctrl+C or close the console window. Dumps are written to directory C:\dumps.
The tool uses a simple process whitelisting by name to rule out some .NET processes that you are not interested in dumping, such as the GarbageMan itself. You can edit the file whitelist.txt in C:\psnotify for modifying this behavior.
You can also use psnotify to dump all processes (not only .NET) with command line option –a. Watch out: this can make your system very slow at times.
Note that the garbage collection prevention requires some work on getting correct debug symbols in place. More information about that can be found in the WithSecure Labs GitHub: https://github.com/WithSecureLabs/GarbageMan/tree/master/psnotify/