Detectree: Detection Visualisation for Blue Teams
“We can easily see patterns presented in certain ways, but if they are presented in other ways, they become invisible”
– Colin Ware, Information Visualization: Perception for Design (Elsevier, 1999)
Detectree is a tool for visualising cyber security events and their relationships.
When provided with detection events from an Elasticsearch index, Detectree determines the relationships between the artifacts (processes, network destinations, files, Registry keys) and displays these graphically. This allows an analyst to gain a deep understanding of a potential compromise almost instantly.
From its humble beginnings as Python code in a Jupyter Notebook, Detectree, now an open-source web application, has become an essential tool within Countercept’s Detection and Response Team. Built from the desire to give our clients the best possible managed detection and response (MDR) service, it has reduced our time to response, facilitated our communication and turned analysis into a profoundly natural process.
GitHub Repository: https://github.com/countercept/detectree
Why Visualise Detections?
The answer to this question is expressed eloquently by the quote from Colin Ware at the top of this blog post:
“We can easily see patterns presented in certain ways, but if they are presented in other ways, they become invisible”
In the case of blue teams, our ‘patterns’ are the relationships between artifacts (i.e. processes, network addresses, files etc.) flagged by cyber security detections on an endpoint.
Looking at a single cyber security detection is never enough. Even in the case that we observe execution of something as obvious as mimikatz.exe, the questions of “how did this originate?”, “what else did the user do?” and “how do we remediate this?” remain outstanding. By mapping the relationships between detections, Detectree makes visible connections that were otherwise invisible and allows us to rapidly answer these questions.
How to Use Detectree
After installing, Detectree runs a small webserver on the host of your choice (this can be remote, or your localhost). It can then be configured to retrieve data from an Elasticsearch index of detections, by simply providing it the following information:
- The address of the Elasticsearch server
- Authentication for the Elasticsearch server
- The mapping between Elasticsearch and Detectree fields
Once running, the UI will be accessible via a browser, and a detection tree can be generated by inputting the unique identifier of the host and the date range of interest.
Case Study
The table below shows a list of processes that have been tagged via automated detection logic. We can see the process, its parent, the name of the detection (why the event has been flagged) and its severity.
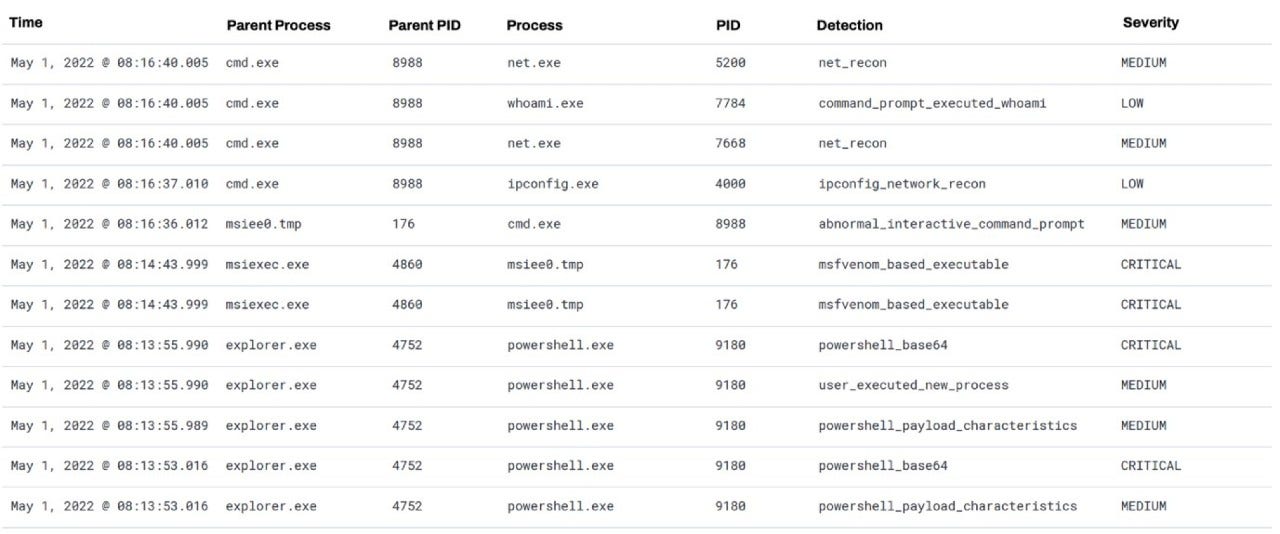
In the top four rows, we can clearly see cmd.exe launching several reconnaissance commands. However, a key task of an analyst is to determine the origin and the extent of such suspicious behaviour. By looking down the rows, and with some effort, we can find cmd.exe is spawned by msiee0.tmp, which was spawned by msiexec.exe. We can see that msiee0.tmp had a ‘critical’ detection assigned to it.
This is the inefficient approach an analyst must take to find relationships between data-points in textual format. We begin to form a mental image of this process chain, and the importance of each process. After two or three processes this becomes unmanageable, and we are left triaging each process in isolation.
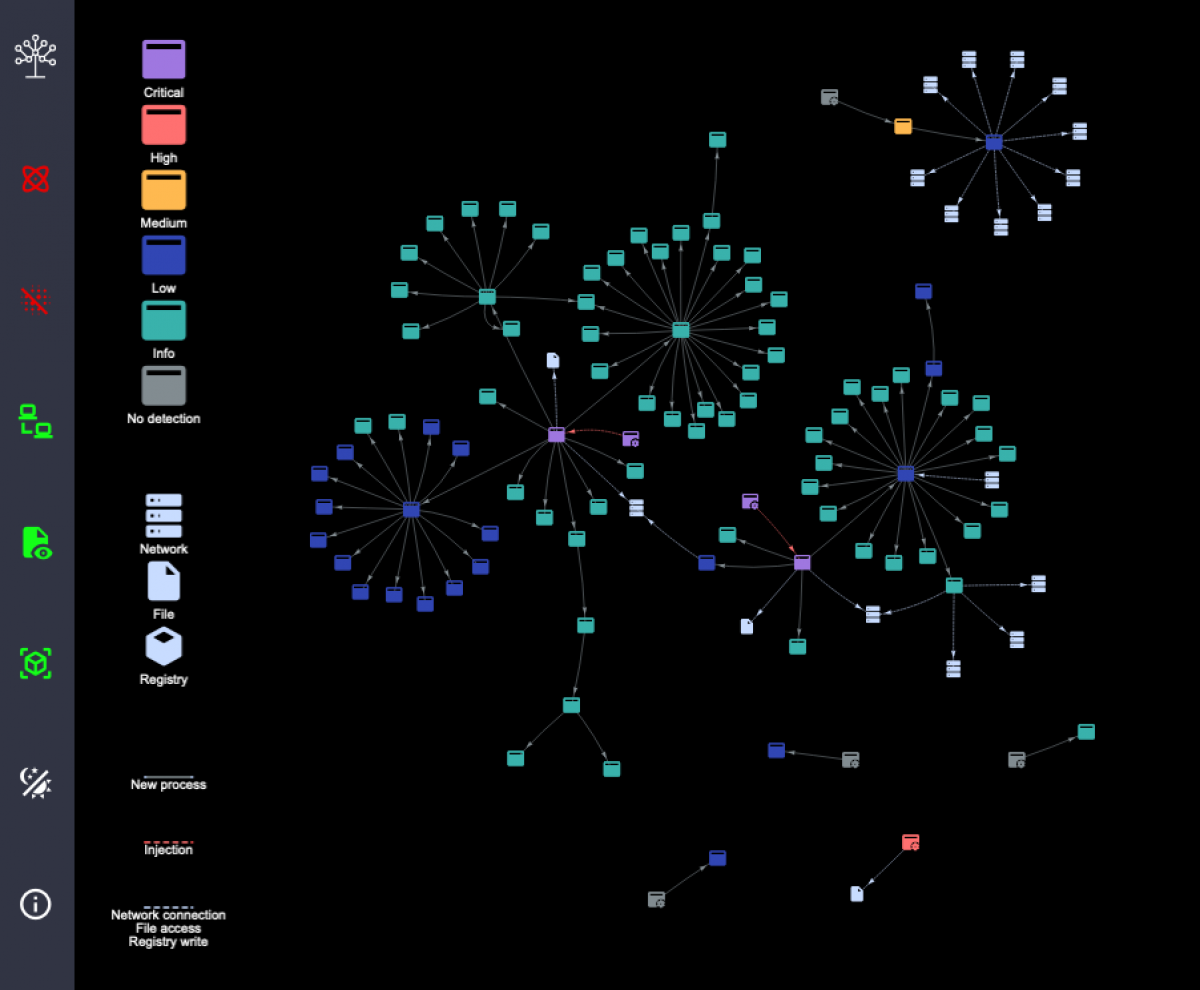
However, by using Detectree, we can represent all the data of interest on an endpoint in a fundamentally intuitive way:
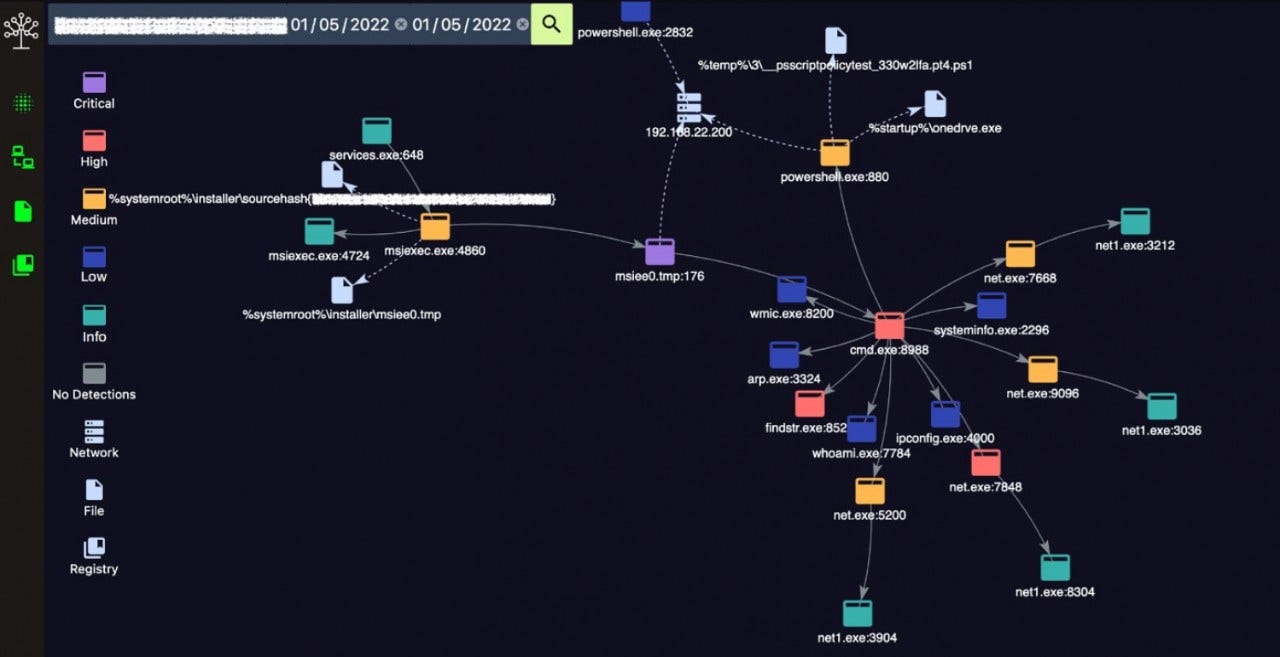
Within seconds, and without any apparent effort, we can come to the same conclusion as we did so previously: msiexec.exe spawned msiee0.tmp spawned cmd.exe. We see the ‘critical’ detection on msiee0.tmp, and the severity of the detections associated with the other processes.
However, Detectree gives us more than just a colourful process tree. Interactions with other artifacts are also displayed: msiee0.tmp has also made network connections, and msiexec.exe has interacted with two files. The relationships between these artifacts would have remained largely invisible in textual detections without taxing work by an analyst.
By shifting from text to a visualisation, we are profoundly improving the way in which an analyst can acquire information from our data points. This, in turn, enhances the analysis performed and ultimately results in better service delivery.
Feature Highlights
Application Nodes

An Application Node represents a process with a detection
Its colour represents the maximum-severity detection attached to the process
If mapped within Detectree's configuration, hovering over an Application Node will show information such as the user and arguments relevant to the process
Context Nodes

A Network Node represents a network addresses
A File Node represents a file
A Registry Node represents a Windows Registry Key
Edges
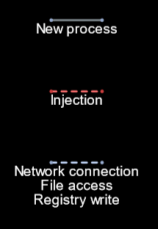
A New Process Edge represents a process spawning another process
An Injection Edge represents a process injecting content into another process
A Context Edge can represent a network connection, file access or Registry write event. These will always join an Application Node and the relevant Context Node.
Filters

The first option will show/hide single nodes
The second option will show/hide Network Nodes
The third option will show/hide File Nodes
The fourth option will show/hide Registry Nodes