Heap tracing with WinDbg and Python
By Sam Brown on 19 April, 2016
This post will demonstrate how to write basic WinDbg scripts with Python and how to put together a basic heap visualiser.
All of the example code for this post can be found here.
Setting up PyKd
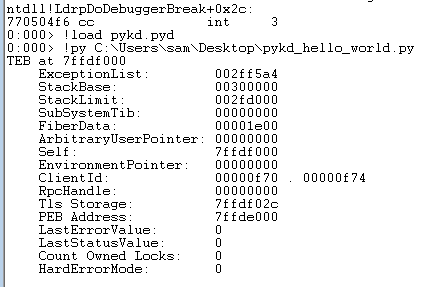
We will be using PyKd which provides a python library wrapper around WinDbg's API to allow us to interface with WinDbg using Python. First you'll need WinDbg installed on your system as well as Python 2.7.10 or earlier. Currently 2.7.10 is the newest Python version you can use with PyKd as newer versions have stability issues when using WinDbg. Now download the automated PyKd installer here and you're ready to go. Once you have installed PyKd, open up Windbg, attach to a random process (I chose Notepad++) and then load PyKd by running "!load pykd.pyd". Now we can create a little test script:
import pykd
print pykd.dbgCommand("!teb")
Which we then save and execute by running "!py $path_to_script" as shown below:
Function hooking
We are going to hook the Windows memory allocation functions by just setting breakpoints on the entry and exit points of each of them, gathering the information we need and then letting execution resume. First we create a function to get the address of any functions we want to hook.
import pykd
def get_address(localAddr):
res = pykd.dbgCommand("x " + localAddr)
result_count = res.count("\n")
if result_count == 0:
print localAddr + " not found."
return None
if result_count > 1:
print "Warning, more than one result for " + localAddr
return res.split()[0]
Next we create a class to handle our hook. The entry breakpoint that this class handles is created in the constructor.
class handle_allocate_heap(pykd.eventHandler):
def __init__(self):
addr = get_address("ntdll!RtlAllocateHeap")
if addr == None:
return
self.bp_init = pykd.setBp(int(addr, 16), self.enter_call_back)
self.bp_end = None
Now in the callback for the function entry we use PyKd to find the last line of the function and install a breakpoint there. This means that the return_call_back function will be called just before the function returns. By returning False from the callbacks we let the application continue running, if you return True then execution will stop.
def enter_call_back(self,bp):
print "RtlAllocateHeap called."
if self.bp_end == None:
disas = pykd.dbgCommand("uf ntdll!RtlAllocateHeap").split('\n')
for i in disas:
if 'ret' in i:
self.ret_addr = i.split()[0]
break
self.bp_end = pykd.setBp(int(self.ret_addr, 16), self.return_call_back)
return False
def return_call_back(self,bp):
print "RtlAllocateHeap returned."
return False
With this created all we need to do is instantiate the class and it will install its initial hook when loaded by PyKd in WinDbg.
handle_allocate_heap()
pykd.go()
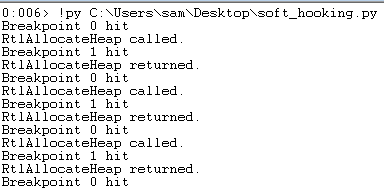
Now we run this in WinDbg and we can see the calls to RTlAllocateHeap being logged.
Heap tracing
Now we need to update our code to extract the arguments RtlAllocateHeap is being called with, and the address it returns by modifying our callbacks to do this. When using the standard calling convention of 32-bit Windows functions, arguments are passed on the stack so we can get the arguments by reading values off the stack as shown below.
def enter_call_back(self,bp):
self.out = "RtlAllocateHeap("
esp = pykd.reg("esp")
self.out += hex(pykd.ptrPtr(esp + 4)) + " , "
self.out += hex(pykd.ptrMWord(esp + 0x8)) + " , "
self.out += hex(pykd.ptrMWord(esp + 0xC)) + ") = "
if self.bp_end == None:
disas = pykd.dbgCommand("uf ntdll!RtlAllocateHeap").split('\n')
for i in disas:
if 'ret' in i:
self.ret_addr = i.split()[0]
break
self.bp_end = pykd.setBp(int(self.ret_addr, 16), self.return_call_back)
return False
Under the calling convention return values are returned in the eax register, so we can just grab the value of that and append it to the rest before printing it all out.
def return_call_back(self,bp):
self.out += ") = " + hex(pykd.reg(return_reg))
print self.out
return False
With our code updated we can run it again.
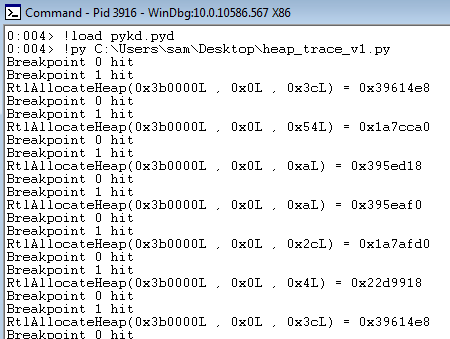
As you can see from running the code, the allocations don't really make sense yet as we can see memory being allocated at the same address repeatedly. This is because we are only tracking allocations and not frees so we add a hook for this as well (and realloc for good measure), we also add support for the 64-bit Windows calling convention and update the code to log to a file rather than to stdout. This gives us the following code:
import pykd
from os.path import expanduser
home = expanduser("~")
return_reg = "rax"
stack_pointer = "rsp"
arch_bits = 64
log = None
def get_address(localAddr):
res = pykd.dbgCommand("x " + localAddr)
result_count = res.count("\n")
if result_count == 0:
print localAddr + " not found."
return None
if result_count > 1:
print "[-] Warning, more than one result for", localAddr
return res.split()[0]
#RtlAllocateHeap(
# IN PVOID HeapHandle,
# IN ULONG Flags,
# IN ULONG Size );
class handle_allocate_heap(pykd.eventHandler):
def __init__(self):
addr = get_address("ntdll!RtlAllocateHeap")
if addr == None:
return
self.bp_init = pykd.setBp(int(addr, 16), self.enter_call_back)
self.bp_end = None
def enter_call_back(self,bp):
self.out = "RtlAllocateHeap("
if arch_bits == 32:
esp = pykd.reg(stack_pointer)
self.out += hex(pykd.ptrPtr(esp + 4)) + " , "
self.out += hex(pykd.ptrMWord(esp + 0x8)) + " , "
self.out += hex(pykd.ptrMWord(esp + 0xC)) + ") = "
else:
self.out += hex(pykd.reg("rcx")) + " , "
self.out += hex(pykd.reg("rdx")) + " , "
self.out += hex(pykd.reg("r8")) + ") = "
if self.bp_end == None:
disas = pykd.dbgCommand("uf ntdll!RtlAllocateHeap").split('\n')
for i in disas:
if 'ret' in i:
self.ret_addr = i.split()[0]
break
self.bp_end = pykd.setBp(int(self.ret_addr, 16), self.return_call_back)
return False
def return_call_back(self,bp):
log.write(self.out + hex(pykd.reg(return_reg)) + "\n")
return False
#RtlFreeHeap(
#IN PVOID HeapHandle,
#IN ULONG Flags OPTIONAL,
#IN PVOID MemoryPointer );
class handle_free_heap(pykd.eventHandler):
def __init__(self):
addr = get_address("ntdll!RtlFreeHeap")
if addr == None:
return
self.bp_init = pykd.setBp(int(addr, 16), self.enter_call_back)
self.bp_end = None
def enter_call_back(self,bp):
self.out = "RtlFreeHeap("
if arch_bits == 32:
esp = pykd.reg(stack_pointer)
self.out += hex(pykd.ptrPtr(esp + 4)) + " , "
self.out += hex(pykd.ptrMWord(esp + 0x8)) + " , "
self.out += hex(pykd.ptrPtr(esp + 0xC)) + ") = "
else:
self.out += hex(pykd.reg("rcx")) + " , "
self.out += hex(pykd.reg("rdx")) + " , "
self.out += hex(pykd.reg("r8")) + ") = "
if self.bp_end == None:
disas = pykd.dbgCommand("uf ntdll!RtlFreeHeap").split('\n')
for i in disas:
if 'ret' in i:
self.ret_addr = i.split()[0]
break
self.bp_end = pykd.setBp(int(self.ret_addr, 16), self.return_call_back)
return False
def return_call_back(self,bp):
#returns a BOOLEAN which is a byte under the hood
ret_val = hex(pykd.reg("al"))
log.write(self.out + ret_val + "\n")
return False
#RtlReAllocateHeap(
#IN PVOID HeapHandle,
#IN ULONG Flags,
# IN PVOID MemoryPointer,
# IN ULONG Size );
class handle_realloc_heap(pykd.eventHandler):
def __init__(self):
addr = get_address("ntdll!RtlReAllocateHeap")
if addr == None:
return
self.bp_init = pykd.setBp(int(addr, 16), self.enter_call_back)
self.bp_end = None
def enter_call_back(self,bp):
self.out = "RtlReAllocateHeap("
if arch_bits == 32:
esp = pykd.reg(stack_pointer)
self.out += hex(pykd.ptrPtr(esp + 4)) + " , "
self.out += hex(pykd.ptrMWord(esp + 0x8)) + " , "
self.out += hex(pykd.ptrPtr(esp + 0xC)) + " , "
self.out += hex(pykd.ptrMWord(esp + 0x10)) + ") = "
else:
self.out += hex(pykd.reg("rcx")) + " , "
self.out += hex(pykd.reg("rdx")) + " , "
self.out += hex(pykd.reg("r8")) + " , "
self.out += hex(pykd.reg("r9")) + ") = "
if self.bp_end == None:
disas = pykd.dbgCommand("uf ntdll!RtlReAllocateHeap").split('\n')
for i in disas:
if 'ret' in i:
self.ret_addr = i.split()[0]
break
self.bp_end = pykd.setBp(int(self.ret_addr, 16), self.return_call_back)
return False
def return_call_back(self,bp):
log.write(self.out + hex(pykd.reg(return_reg)) + "\n")
return False
log = open(home + "\log.log","w+")
try:
pykd.reg("rax")
except:
arch_bits = 32
return_reg = "eax"
stack_pointer = "esp"
handle_allocate_heap()
handle_free_heap()
handle_realloc_heap()
pykd.go()
Running this while WinDbg is attached to notepad++ and clicking about for a bit I end up with the following in the log file:
RtlFreeHeap(0xb20000L , 0x0L , 0xb33eb8L) = 0x1
RtlAllocateHeap(0x230000L , 0x0L , 0x3cL) = 0x24c8570
RtlFreeHeap(0x230000L , 0x0L , 0x24cc4d8L) = 0x1
RtlFreeHeap(0x230000L , 0x0L , 0x24cc4a0L) = 0x1
RtlFreeHeap(0x230000L , 0x0L , 0x24744d0L) = 0x1
RtlFreeHeap(0x230000L , 0x0L , 0xc87d28L) = 0x1
RtlAllocateHeap(0x230000L , 0x0L , 0x54L) = 0xc87d28
RtlAllocateHeap(0x230000L , 0x0L , 0x11L) = 0x2468cf8
RtlAllocateHeap(0x230000L , 0x0L , 0x11L) = 0x2468c58
RtlAllocateHeap(0x230000L , 0x0L , 0x48L) = 0x24d94e8
RtlAllocateHeap(0x230000L , 0x0L , 0x4L) = 0x24794c0
RtlFreeHeap(0x230000L , 0x0L , 0x24794c0L) = 0x1
RtlFreeHeap(0x230000L , 0x0L , 0x24c8570L) = 0x1
RtlAllocateHeap(0x230000L , 0x0L , 0x3cL) = 0x24c8570
RtlFreeHeap(0x230000L , 0x0L , 0x24c8570L) = 0x1
RtlAllocateHeap(0x230000L , 0x0L , 0x3cL) = 0x24c8570
RtlFreeHeap(0x230000L , 0x0L , 0x24c8570L) = 0x1
RtlAllocateHeap(0x230000L , 0x0L , 0x3cL) = 0x24c8570
RtlFreeHeap(0x230000L , 0x0L , 0x24c8570L) = 0x1
RtlAllocateHeap(0x230000L , 0x0L , 0x3cL) = 0x24c8570
RtlFreeHeap(0x230000L , 0x0L , 0x24c8570L) = 0x1
RtlAllocateHeap(0x230000L , 0x0L , 0x3cL) = 0x24c8570
RtlFreeHeap(0x230000L , 0x0L , 0x24c8570L) = 0x1
RtlAllocateHeap(0x230000L , 0x0L , 0x3cL) = 0x24c8570
RtlFreeHeap(0x230000L , 0x0L , 0x24c8570L) = 0x1
Awesome! It looks like our heap tracing is working, the sample log is available here.
Heap Visualisation
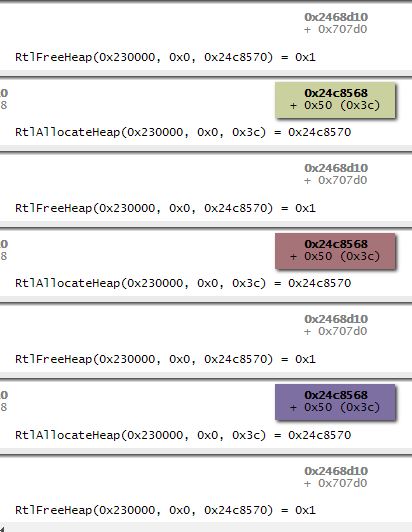
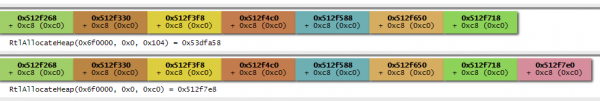
Using a modified version of the villoc heap visualiser we can render our trace information as an HTML diagram. We use 'python villoc.py sample.log out.html' to generate this and you can see a chunk of the output HTML below. In this example, a single block is being repeatedly freed and allocated.
Overhead
I wanted to know what kind of overhead running an application with heap tracing introduced versus running it with a debugger attached. Unsurprisingly, the answer is a lot. I benchmarked the performance by timing how long it took a basic heap spray to run inside of Internet Explorer 9, first with a debugger attached and then with the heap tracing in place. I used a heap spray taken from Corelan for this and modified it to call 'parseFloat' at the start and end of the spray. This call is used to trigger breakpoints which have been set on the function 'jscript9!StrToDbl', allowing us to know when the spray is about to start and when it has ended.
<html>
<script language="javascript">
// heap spray test script
// corelanc0d3r
//Original source: https://www.corelan.be/index.php/2011/12/31/exploit-writing-tutorial-part-11-heap-spraying-demystified/#Visualizing_the_heap_spray_8211_IE6
var a = parseFloat("10");
tag = unescape('%u4F43%u4552'); // CORE
tag += unescape('%u414C%u214E'); // LAN!
chunk = '';
chunksize = 0x1000;
nr_of_chunks = 200;
for ( counter = 0; counter < chunksize; counter++)
{
chunk += unescape('%u9090%u9090'); //nops
}
document.write("size of NOPS at this point : " + chunk.length.toString() + "<br>");
chunk = chunk.substring(0,chunksize - tag.length);
document.write("size of NOPS after substring : " + chunk.length.toString() + "<br>");
// create the array
testarray = new Array();
for ( counter = 0; counter < nr_of_chunks; counter++)
{
testarray[counter] = tag + chunk;
document.write("Allocated " + (tag.length+chunk.length).toString() + " bytes <br>");
}
var b = parseFloat("10");
</script>
</html>
I used the below script to get the run time with just a debugger attached. Then I used a modified version of the heap tracing script which includes the same timing logic to do the same with heap tracing, the timing scripts can be found here.
import pykd
import timeit
start = timeit.default_timer()
def get_address(localAddr):
res = pykd.dbgCommand("x " + localAddr)
result_count = res.count("\n")
if result_count == 0:
print localAddr + " not found."
return None
if result_count > 1:
print "[-] Warning, more than one result for", localAddr
return res.split()[0]
class time(pykd.eventHandler):
def __init__(self):
addr = get_address("jscript9!StrToDbl")
if addr == None:
return
self.start = timeit.default_timer()
self.bp_init = pykd.setBp(int(addr, 16), self.enter_call_back)
def enter_call_back(self,bp):
end = timeit.default_timer()
print "Heap spray took: " + str(end - self.start)
return True
time()
pykd.go()
After running each timing scripting multiple times and averaging the times taken, I ended up with an average run time with a debugger attached of 0.016 seconds and 17.1 seconds with heap tracing. This gives a rough total overhead of about 1000 times (1046.46 to be precise).
Visualising a Heap Spray
To provide an example of the tracer scripts output combined with villoc, I ran the tracer script on Internet Explorer 9 running on a 32-bit Windows 7 Service Pack 1 machine while it was being exploited by the 'ie_execcommand_uaf' exploit which is included in Metasploit (more details on the exploit can be found here). This exploit utilises a heap spray which we can clearly see in the generated visualisation. For example, from the following two image taken from the full picture we can see how memory allocations of the same size are allocated continuously in a predictable way.
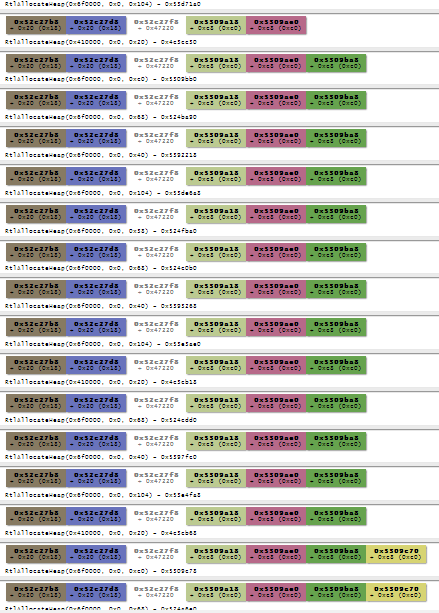
The full trace file used to generate the visualisation is included in the Github repository as 'ie_execcommand_uaf.zip'.
Having access to the raw heap trace can also be useful during the exploit development process. For example, when exploiting MS15-061, a Windows Kernel Use-After-Free vulnerability (full details are available in the whitepaper), Dominic Wang used several WinDbg scripts to monitor the state of the user land heap and ensure it was being manipulated as expected.
Conclusion
Being able to quickly create and modify existing debugger scripts is a useful tool in an exploit developers belt, allowing them to gain a greater understanding of the state of the target software during exploitation. The Villoc visualiser is too heavy weight for continuous usage during the exploit development process but provides an easy way to bring more clarity when trying to finesse complex components of heap based exploits.
Credits
I originally learned about soft function hooking with windbg and python from this blog post by Rich Lundeen which is also where I modified the 'getAddress' function from. The blog post walks through using soft hooking to change the IP address being passed to 'inet_address', it's well worth a look if you want someone else's take on using windbg and pykd for these kind of projects.