ESFang - Exploring the macOS Endpoint Security Framework (ESF) for Threat Detection
By Connor Morley on 20 December, 2021
Executive Summary
Endpoint Security Framework (ESF) is the new(ish) security auditing tool that Apple has introduced to provide the security industry with a one stop shop for all its telemetry needs. Released in MacOS version 10.15 in 2019, the ESF is capable of providing real time telemetry for detection and automated defensive purposes. However, despite this component being introduced in 2019, it wasn’t until late 2020 that most of the industry started taking notice (going by the posts and availability of POC codes for its use).
This blog will cover an overview of ESF, why it was introduced, how the ESF can be used in active threat detection, the issues with data collection, and an example use case against the Meterpreter agent on MacOS 11.2.2. Additionally, this blog will aim to highlight key points of interest in the ESF system encountered during a real life deployment operation.
This blog will also explain some of the reasons behind why the ESF system was introduced by Apple, in response to both security industry requirements and the company’s future plans for deprecation of the Kernel Extension (KEXT) access in later OS versions. Despite warning of this deprecation being introduced in 10.15.4, now at 11.2 KEXTs are still operational. How long this will remain the case is yet to be outlined by Apple.
What is ESF?
Prior to the release of the ESF, the primary auditing system in MacOS was OpenBSM. OpenBSM was the “Opensource Basic Security Module” developed by Sun Microsystems and integrated into MacOS Darwin (MacOSX). The system was included to attempt to provide security logging functionality by leveraging the open source system. However, despite it working to some extent, OpenBSM had a number of issues that made it challenging to use. This blog will not dive into these as there are many papers out there that go into deep technical details on the issues and their causes. Instead, the blog will highlight some of the most prominent issues which spurred the security community into petitioning for an improved system.
One of the most notorious issues was how difficult it is to use OpenBSM within security systems – typically it requires a lengthy development process. This complexity, as well as the difficulty in general implementation, made the tool clunky at best. OpenBSM was also prone to kernel panics, information leakage, and heap overflow issues making it unstable within security related binaries. Finally, a major issue was that OpenBSM was a reactive logging mechanism, and therefore could not be used in a proactive capacity for operations such as anti-virus or host based defence systems. Essentially, the system queried event data after the event had occurred, which in fast operations conducted while the OS is under heavy load can result in loss of key data.
ESF is a significant improvement over the OpenBSM design, providing a far more effective framework to monitor and respond to threats on macOS systems. Compared to the implementation methods required for OpenBSM, ESF is extremely simple, requiring the user to only generate an ESF client instance and then monitor the client data stream for output event data. The client instance taps into the underlying ESF subsystem and subscribes to event types specified by the user. When any of these event types are generated, the information is relayed to the client which in turn can be handled by the system that generated the ESF client instance.
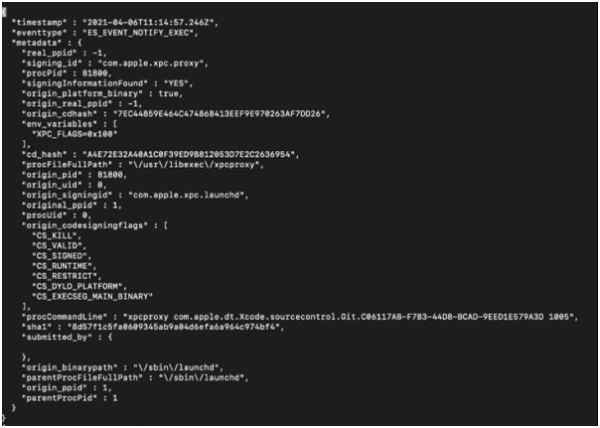
Image 1 – ESF data stream output formatted into JSON
The event types that a client can subscribe to are extensive and constantly being updated and added to in OS updates. During examination it was found these can be seen in the Xcode ESF SDK development file:
/Library/Developer/CommandLineTools/SDKs/MacOSX10.15.sdk/usr/include/EndpointSecurity/ESTypes.h
Within the event types listed in this file, at the time of testing, an ESF client could be subscribed to 89 different event types. A full list has been provided at the end of this blog, and these include process execution, file access, IPC socket creation, memory operations, and many more.
The ESF works in a similar way to ETW on Windows systems in the sense that it has a number of different data feeds that you can tap in to to record events of interest. While ESF is always running, the data it collects and how it can be used as part of a security monitoring system does come with some caveats – which will be discussed later in this paper.
Why is ESF becoming mandatory?
To overcome the shortfalls of OpenBSM, many security vendors for MacOS have opted to use KEXTs instead. The use of KEXTs allows for real time telemetry to be attained and therefore security operations to be conducted in a proactive manner. However, as Apple is revoking all third-party access to the Kernel environment[10], this workaround will soon expire as an option. As of MacOS version 11.2, KEXTs are still operational, but Apple is still insisting this is a just a temporary extension to allow vendors to find new solutions before they pull the plug entirely.
Therefore, as OpenBSM is insufficient for modern security system operations and KEXTs have a rapidly shortening shelf life, the use of ESF or other telemetry collection methods is soon to be a necessity.
How can we use ESF?
As mentioned previously, the method of tapping into the ESF subsystem to acquire its telemetry is relatively straight forward. Within a tool of the user’s design, you import the “EndpointSecurity” libraries and, using their content, you can construct an ESF client. This client allows the user to specify a list of event types it will subscribe to when initiated. Once initiated, the client will perform a callback operation any time one of the events specified is generated by the subsystem. The information can then be captured via the callback from the client and handled by the user’s calling application.
Event types are not uniform and have different structures; as such they must all be handled in a unique fashion and the contained data formatted for human use (I typically use JSON). The data included in events is very detailed, an example being the process execution data event. In this event the information of the executable, path, PID, parent process, parent process ID, executable code, signing status and user ID are all included. The returned data for each event type is outlined in the file “ESMessage.h”.
It is worth noting at this point that ESF documented usage is for Objective-C and Swift coding, there is very little outlining utilisation with other languages such as C++ or Rust. Despite this, I have observed projects in progress that create packages to tap into ESF for multiple languages outside those covered by Apple’s documentation.
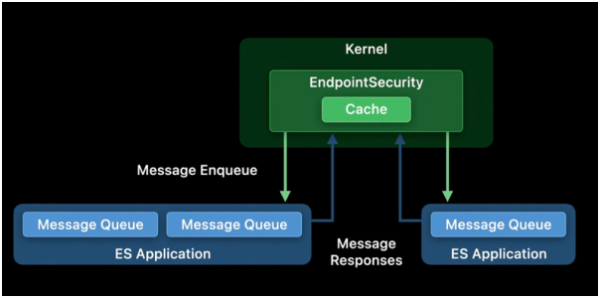
Image 2 – ESF location and utilisation [11]
There are several tools that can be used for ESF telemetry collection; these include FireEye’s Crescendo[5], Objective-See’s FileMonitor[6] & ProcessMonitor[9], Omark-Ikram’s EndpointSecurityDemo[1] and Chris Ross’s Appmon[2]. These tools have a range of complexity and user friendliness (UIs etc), but are all great tools to use and provide a direct example of how this telemetry can be accessed and the types of output that can be used by the wider industry. The associated papers and publications with each tool provide a deep insight into the employment of this subsystem in modern security systems and a number of issues that have already been overcome. However, on using these tools for offensive operation analysis, I found issues with all of them. Under close examination, these problems turned out to be issues with the ESF architecture itself.
Problems with ESF implementation
During experimentation with the ESF ingestion solutions I found several issues with the currently available tool sets already developed, as well as during development of my own ESF tool. Below I will outline these issues and their identified or perceived causes.
Note: Since this research was conducted Apple have released a new SDK (10.15.4), which adds a "seq_number" attribute that allows for tracking of event publication gaps that may resolve some of the bottleneck issues discussed below.
Bottleneck issue
DISCLAIMER – When my research began I was working on a raw version of SDK 10.15, however this was silently patched during the course of my research and development. Post-research reflection shows a significant discrepancy in the ESMessage and ESTypes used from this SDK from the start and end of this project. This discrepancy is between the event types and the introduction of the “seq_num” in ESMessage.h from the start and end versions. As the client and message handler were built first they were developed against the unpatched 10.15 SDK which did not have “seq_num” in ESMessage.h. When adding in the event types the host was updated to the latest version to accommodate testing, this unknowingly updated the SDK to include the newer event types but also the “seq_num” attribute which was unfortunately overlooked.
It is worth noting that "seq_num" can be used to identify when silent event dropping occurs by checking for gaps in the sequence ID attributed to an event for a specific event type, which was a key issue with bottlenecking; however, the issue does still exist due to the kernel level subscription overload.
During analysis with existing ESF tools and my own, I regularly came across a bottlenecking issue, which from my analysis was caused by one of two issues. Either the internal ESF client object instance opened too many file handles concurrently (General Error 24) or the capacity of the ESF client instance is overloaded as the influx of events reaches an undetermined internal threshold. This creates a significant issue as it means that a single ESF client object instance cannot be subscribed to too many event types, or otherwise it risks the dropping or loss of data.
When the ESF client’s internal overload occurs, the client will not indicate it has happened in any way, and the data is not queued for later retrieval. Instead, the client silently drops the data that is over the queue/threshold limit. This can be easily observed when examining execution data event types (prefixed with EXEC) for malicious agents. When all the event types are subscribed to by a single client, the malicious application/binary execution data events were regularly not found in the resulting data output; whereas, if a client just subscribed to the execution data events then these can be found.
Finally, the data omissions were inconsistent during different experiments. Depending on the events that came through the client or if there was any background SYSTEM activity being conducted, the relevant data retrieved during experiments would vary significantly based upon the verbosity of activity. As such, any further integration of ESF telemetry should take this into serious consideration, especially when dealing with particularly verbose event groups (file and file metadata in particular).
Below are two possible solutions I came across.
Event Muting
One potential way to overcome the bottleneck is to employ event muting. This is a feature that was introduced into the ESF client object in late 2020 and allows for a user to specify either process ID (via token) or a process literal path to be ignored by the client in relation to all events. This is an extremely powerful mechanism and in testing did overcome the bottleneck issue, however it had limitations in terms of flexibility for dynamic/distributed use.
During my experimentation users were presented with a choice of either omitting several internal utilities that were spammed by the SYSTEM process such as xpcproxy or mdworker_shared, or filtering by process token which is a unique identifier for each process instance. The latter option did not work, as the SYSTEM/daemon did not hold the process token for enough time before spawning another. As such, I had to implement a search and destroy filter in the code to match up with very specific criteria utilised by the SYSTEM and mute on each event.
However, use by SYSTEM meant that data points like file path etc would be randomly generated for scripts or other files in various temporary directories. This meant that patterning of anomalous behaviour had to be dynamic, which in turn created the potential for true malicious behaviour to be filtered out accidentally through the dynamic filters. Although my filters during testing were extremely basic the results were not promising, and this line of development was abandoned due to time constraints and complexity. Additionally, muting on an entire process path is possible, but if an attacker leverages one of these standard utilities for malicious objectives, detection systems would be completely blind to it. Although this is an option, the specified process would need to be of no risk from a security standpoint, otherwise there is a of risk being blind to potential future exploitation.
Multi-client
This option requires the implementation of a controller managing multiple ESF client object instances. This was my original plan for my POC tool used in this research, however due to my inexperience with Objective-C, the implementation would have taken too long. As a result, I used a genre-based specification instead to group event types together such as those for process activity or file manipulation.
If a system utilised multiple ESF client instances for small groups of event types, or handled more verbose event types individually, in theory the bottleneck would be alleviated as the clients would have their own queues which are not being cluttered by multiple event types. This would not solve the General Error 24 issue as this is a system wide limitation, however other controls could be implemented to manage file access events if necessary. This solution could prevent the silent omission of data.
SYSTEM related event verbosity
One of the most inevitable issues with handling new data sets is filtering out the standard operations from those that are of interest. With ESF almost every event type is bombarded continuously by internal SYSTEM operations, daemons or even general maintenance operations. To overcome this issue, strict post-acquisition filters will need to put in place to omit a wide array of data that the ESF client will generate (unless muting is utilized successfully). This currently makes manually filtering through the noise extremely difficult, and presumably any database load as well. As such, addressing this is advised as a matter of ESF utilisation in security monitoring systems.
Real Parent Process ID
Due to the way Cross Process Communication (XPC) is used within MacOS, the parent process ID (PPID) of a process is regularly related to either “launchd” or “runningboard” which are both daemons used to launch processes. This was a well-known issue in MacOS with many workarounds for “launchd” real parent ID (RPID) resolution. However, the introduction of “runningboard” means the issue is ongoing. Therefore, during utilisation of ESF data, the PPID data must be filtered through a sufficient system to generate the RPID when the PPID resolves only to an execution service.
With the POC that I created there is a solution in place for “launchd” RPID resolution, however a “runningboard” RPID solution has not been added yet.
My ESF telemetry solution
Heavily leaning on the work done by Chris Ross[2], Omark-Ikram[1] and the team at Objective-See[6][9], I have devised my own ESF telemetry collection tool. The tool is aimed at being adaptable for analysts and allows for a workaround of the issues outlined above (except the “runningboard” RPID issue). Named “ESFang”, the tool works by tapping into a list of ESF event types specified in an external configuration file. This can be done either by an individual event type basis or by groups such as process, file, sockets etc.
The group events have some of that “genre” of event omitted due to the output of the events being verbose meaning there is inbuilt omissions in the event grouping. Due to the verbosity, their inclusion is likely to cause silent dropping of events in relation the other types in that group. To include them, they must be added via the specific event which has a warning attached.
The output of the data collection is piped to individual event log files which are grouped under their event genre. I purposefully separated the events into different log files as the accumulation of thousands of event types in one file in JSON format was unwieldy. With separate files, an analyst will be able to cross-reference the events within each event log for the time frame they occurred, in order to determine related activity across different areas of interest.
The biggest difference in this tool are the generated logs: analysts can collect output for any duration of their experiments for analyse afterwards. In addition, the tool provides fully flexible collection of events to prevent (or even test) the bottlenecking issue that occurs within the ESF client itself. This approach minimises the risk of data loss while allowing only relevant data points to be collected during the period of experimentation.
The tool is a work-in-progress POC and is relatively easy to adapt by any user with Objective-C coding experience. The POC project source code can be found here:
https://github.com/countercept/esfang
ESF analysis use case – Meterpreter Agent
This section will contain a use case for ESF telemetry analysis against the Meterpreter agent. The objective of this analysis was to highlight the event output of specific operations, their detectability against standard operations, and a comparison against legacy telemetry systems (OpenBSM and KEXT). This will highlight the current disparity between the two data sources in relation to detection capability.
The analysis shows that legacy telemetry has the capability to detect only a fraction of what can be correlated from the ESF data acquired. Although detection is possible with legacy data, with the incorporation of ESF data (which is inherently necessary due to KEXT retirement), the coverage could be improved with relatively little effort. As such, I have assigned values to different event types for incorporation into data acquisition based on their capacity to assist in detection capabilities using current techniques and tool sets typically used by threat hunters (see graph 2 towards the end of this post).

Graph 1. ESF event type telemetry generated by operations
As the local analysis does not consider data handling operations such as post-acquisition filtering, as is necessary in enterprise monitoring, there will inherently be more data points. The analysis of the filtering process is not being assessed here, merely the current detection coverage that can be possible with ESF event types. Finally, my assumption on detection capability is based on the analysis of the local data in relation to the threat hunting methodology, it does not take into account the fidelity of the detection capability in relation to enterprise environment data. Essentially this means that detection from the data acquired is possible; however, the false positive percentage cannot be ascertained without trialling the detection criteria against a larger authentic data pool, which falls outside the scope of this paper.
Event types recommended for incorporation
During testing the MacOS version was 11.2.2.
This section will list the event types in descending order of perceived value for detection and therefore incorporation into macOS detection systems. For further details on value assigned, please read the following sections. All event types assessed during my examination are for NOTIFY events only as AUTH events are of limited value in relation to malicious behaviour detection (unless monitoring for internal brute forcing or UBA activity detection is an objective, however this is outside scope of this paper).
ES_EVENT_TYPE_NOTIFY_OPEN
ES_EVENT_TYPE_NOTIFY_CREATE
ES_EVENT_TYPE_NOTIFY_FCNTL
ES_EVENT_TYPE_ NOTIFY_WRITE
ES_EVENT_TYPE_ NOTIFY_READLINK
ES_EVENT_TYPE_ NOTIFY_MMAP
ES_EVENT_TYPE_ NOTIFY_MPROTECT
ES_EVENT_TYPE_ NOTIFY_IOKIT_OPEN
ES_EVENT_TYPE_ NOTIFY_UIPC_CONNECT
From other research conducted against other C2 post-exploitation systems I am also aware that the following events can have easy wins for detection, although this is not presented in the data for the Meterpreter agent.
ES_EVENT_TYPE_NOTIFY_PTY_GRANT
ES_EVENT_TYPE_NOTIFY_DUP
ES_EVENT_TYPE_NOTIFY_STAT
ES_EVENT_TYPE_NOTIFY_RENAME
ES_EVENT_TYPE_NOTIFY_SETMODE
ES_EVENT_TYPE_NOTIFY_SETEXTATTR
ESF detection in numbers
This analysis was conducted only against the Meterpreter agent and its default capabilities and not exploitative tools for agent deployment or malicious post-exploitation modules hosted in the Metasploit Framework. As such, the activity tends to be more subtle which is potentially why it was being missed in the legacy telemetry. Data was collected by each default capability being executed independently and the data logged before moving onto the next capability in order to get an accurate data set related to that singular function. The specified event types identified as providing insight should be universally valuable, however as they have not yet been cross checked against exploitation leveraging techniques, this is only an assumption.
All ESF data within this experiment was collected via the use of my POC ESF telemetry acquisition system ESFang.
From the analysis conducted, there was a stark increase in the detection capability when comparing ESF to legacy data. With the legacy telemetry I was able to detect only two operations from the Meterpreter agent, the installation and the system information enumeration operation (sysinfo). This was because they both use an anomalous sw_vers command which is rarely seen in normal operations and allows for easy rule creation based on this criterion. As these actions are conducted by the agent on every initiation, this is an accurate detection rule. However, my analysis continued as the objective was to determine the disparity in data points rather than find a conclusive detection method.
In contrast, the ESF data as a local (one host) analysis was able to potentially detect eight operations including installation and sysinfo. In stark comparison, the legacy data generates 10 data points all only directly related to the agent binary when it is installed. The ESF data however generates 259 data points. Although quantity is not always beneficial, it is understood that with more data to reference you are more likely to be able to generate better accuracy, especially if the malicious activity can blend into standard operations.
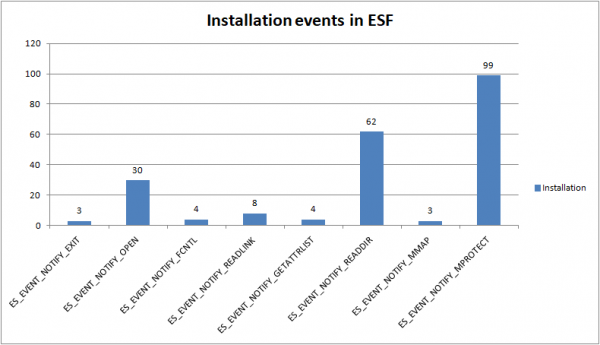
Graph 2. ESF data points generated on agent installation
The dramatic increase in data points does cause a potential issue with DB overloading with verbose data, especially when a number of the event types are prone to verbosity due to SYSTEM process input. Filtering of the SYSTEM process information however should leave the analyst (and infrastructure) with only the data that is relevant during any given incident. This, of course, assumes an attacker does not find a way to leverage a standard SYSTEM process command format for malicious usage (which is not out of the question). However, the mechanics of filtering are beyond the scope of this paper.
This data point comparison is based on the analyst knowing the process name and PID, then filtering on those points across the available data set. This is a standard process chain identification, yet the outputs from both sources are very different. The most pressing issue is the file access identification, the legacy data is extremely lacking in comparison, and it is one of the most powerful identifiers.
Event type priority list reasoning
OPEN
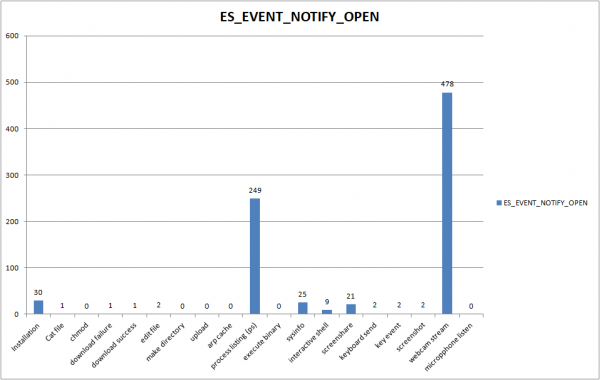
Graph 3. Open events generated for meterpreter functions
This event records all file open operations. This event type triggers whenever a file or directory is opened by a user/program. This is arguably the most important part of the file monitoring element of ESF. In almost all operations for the post-ex agent, the open event was triggered. Normally this event by itself is not enough to determine malicious behaviour, however, when correlated against other suspicious activity and linked to a UID or PID/PPID, this can reveal intention and malicious manipulation that is occurring. As such, this event type has the highest priority as it provides large amounts of data for analysts, with a clear view of what is being accessed by a particular process, which provides valuable context.
CREATE
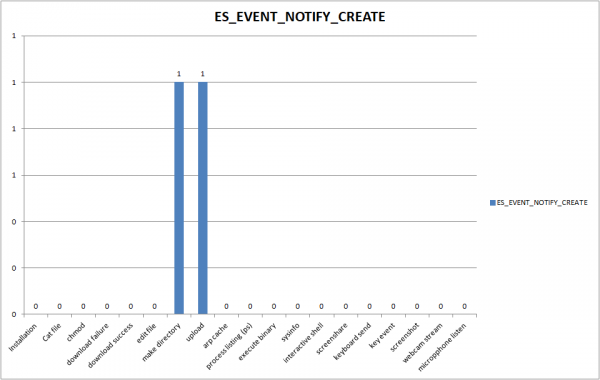
Graph 4. Create events generated for meterpreter functions
This event records all file creation operations. As with most malicious operations (except file-less), especially those with persistence, something is created on a victim’s machine in order to gain a foothold, expand the malicious capability of an attack or maintain persistence on a host. For all these operations, the create event is triggered. Whenever any file is created on the host, the ESF generates an event type specifying both the creating process and the file that was created. When dealing with active malicious actors, this can provide valuable insight into their activity and binary locations when system and known good activity is filtered out (web browsers, third party security systems).
FCNTL
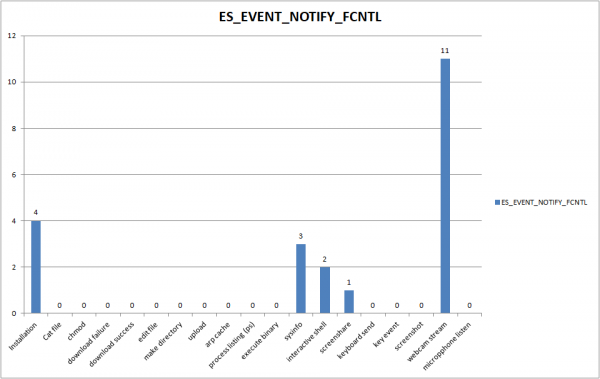
Graph 5. FCNTL events generated for meterpreter functions
This event records all open file control operation. This indicates alterations to a file descriptor, most of the time to get the file flag indicating a process is trying to gain dynamic access (command 3 F_GETFL – get filestatus flag, see fcntl.h). This is commonly seen with malicious behaviour being executed, typically with odd fcntl commands to unusual files which makes them patternable for certain activity (commands 98, 97, 101). This has not been checked against wider regular enterprise activity.
- Command 3 – get file status flag
- Command 98 – Check if library validation allows Mac-O file to be mapped into calling proc
- Command 97 – Add signature from same file, return end offset
- Command 101 – Synchronous advisory read fcntl for regular and compressed file
WRITE
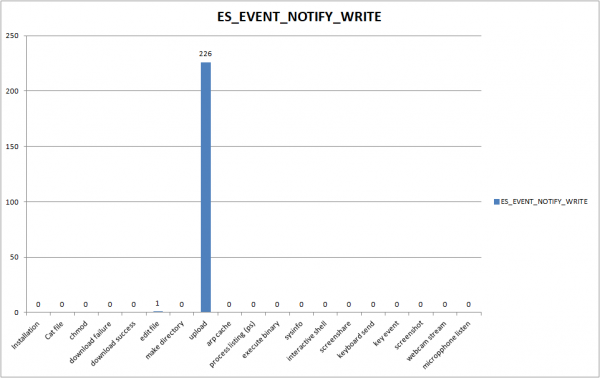
Graph 6. Write events generated for meterpreter functions
This event records all the file write operations. As with create, this one is pretty self-explanatory in relation to value justification. Whenever a process writes to a file, especially if it has just created it, this can be a strong indicator of anomalous behaviour if it comes from an anomalous or non-editing process. For some activity, such as uploading files, repeated write events can indicate that something is being transmitted in blocks (4098) which again are an easy win to detect controlled data retrieval from unusual sources.
READLINK
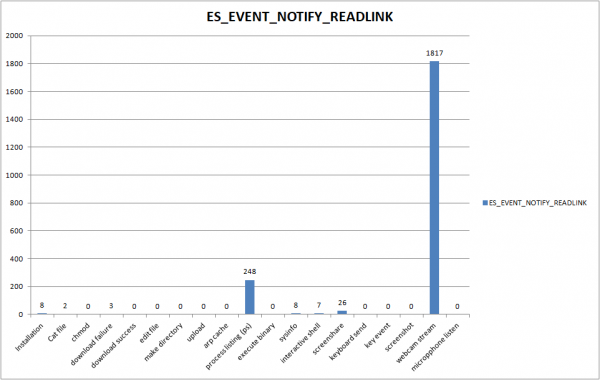
Graph 7. ReadLink events generated for meterpreter functions
This event records all symbolic link read operations. For almost all anomalous operations, the agent was found to read the link to “/etc/” which was pretty universal for almost all operations regardless of their complexity. If the standard use of the readlink operation – that is extremely verbose – from the SYSTEM processes is filtered out, this can provide some detection capabilities. Additionally, in my testing all readlink operations were to “/etc/” from both the agent and the system usage. Therefore by that observation you may conclude that any readlink operation from SYSTEM, or more generally from across the endpoint, that is not made to “/etc/” should be considered anomalous and require investigation. However, in practice this is of course inaccurate as there are legitimate operations using this functionality outside this definition. Rather, in the case of an incident, this telemetry when cross refenced with other IOC’s would again provide insight into potential advanced techniques used to jump around the system or create persistence mechanisms via malicious symbolic links which can be easily identified via this data.
MMAP
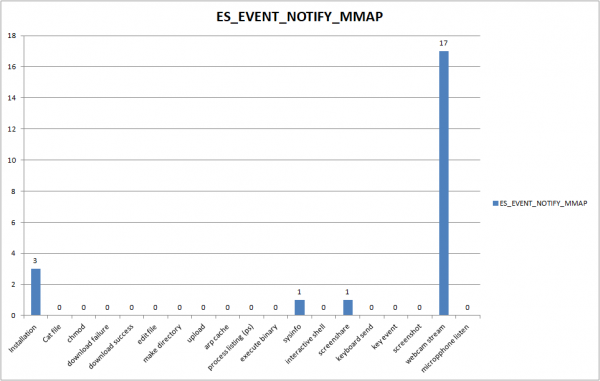
Graph 8. MMAP events generated for meterpreter functions
This event records all the memory mapping operations. During analysis of several operations, particularly in relation to library files, it is possible to see anomalous mappings either into its own process or other specific processes. This can be patterned, for example with Meterpreter it maps the file “icudt66l.dat” into memory for both the sysinfo and screenshare operations – this is the “International Components for Unicode” library file (version 66 Little Endian ASCII). In testing, for standard system operations this .dat file is usually only used by fdsetup and system_profiler instances, which are the file vault utility and software/hardware configuration scanning utility. Therefore, tuning out these known benign activities for these library files could help narrow down malicious behaviour.
MPROTECT
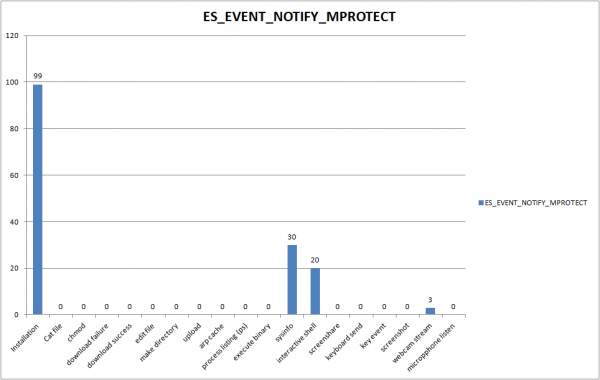
Graph 9. MProtect events generated for meterpreter functions
This event records all memory protection change operations. Memory protection events are very common on a system, but again for some events, they conduct unusual activity. In the case of installation, running an interactive shell, and running sysinfo then memory protection was assigned to the process “/bin/sh” from the malicious agent. Memory protection being assigned to this process is unusual when tested against normal terminal behaviour and standard system activity. As such, particular memory protection events can be used to fingerprint anomalous, if not specifically malicious, activity.
IOKIT OPEN
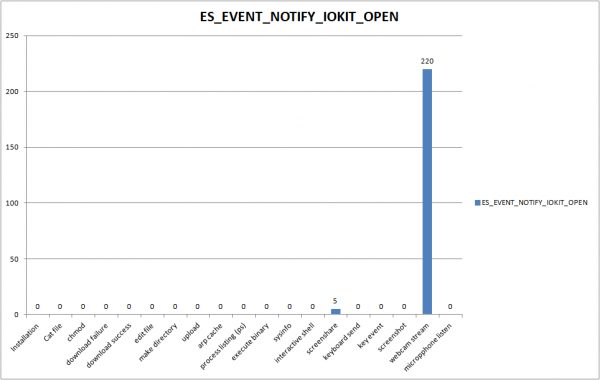
Graph 10. IOKIT events generated for meterpreter functions
This event is related to the connection of hardware to a host and is listed under the kernel extension umbrella of events. This type of event is triggered in Meterpreter when screenshare or webcam monitoring is executed; this then engages specific user classes to enable functionality. The I/O kits enabled for malicious use in the case of those two operations revolve around driver accelerator, graphic card interface (AMD-RADEON-X4000, installed version is RADEON pro 555x), video drivers, and command queues (this seems to be used in a buffer capacity for webcam streaming and re-fires on a loop until the stream closes). SYSTEM based activity which was found to trigger similar events were due to “AppleAPFSUserClient” which is loaded by finder and is the internal client used to interface with the new APFS file system. Other than this, it is rare to see activity in the I/O kit event listings and therefore should make malicious detection easy relative to other verbose event types.
UIPC CONNECT
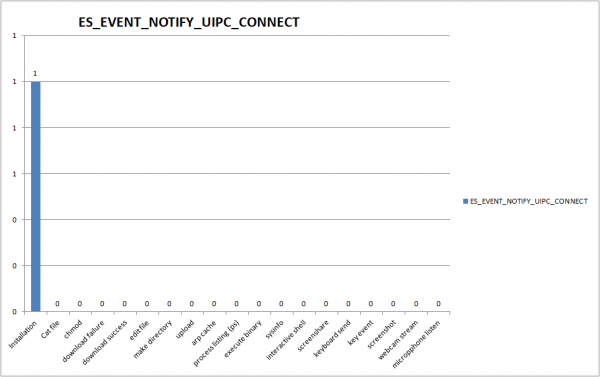
Graph 11. UIPC connect events generated for meterpreter functions
This one is fairly self-explanatory, this event logs when an Inter Process Communication(IPC) socket makes a successful connection. The event includes the domain (defines location of traffic, including PF_UNIX for internal pipe), socket type, defined protocol (0 = UNIX internal protocol), origin process information and target information. The parenthesised socket information above shows the activity logged for the Meterpreter installation; in this case it only logged that the binary created an internal process pipe to the mDNSResponder which is used for network connection management. This is an inter-process communications monitoring event type and allows analysts to monitor for anomalous IPC communication pipes established from particular processes.
Extra events outside Meterpreter scope
Below are some event types which provided valuableinsights when analysing OST frameworks besides Meterpreter. Instead of outlining every framework analysed I will instead highlight the event types of interest and which specific operations they assisted in identifying during experimentation.
PTY GRANT
This event records all the pseudo terminal creation and process access grant operations. This event type is valuable due to my research on the Sliver[13] offensive framework, so this is more “an extra” to the Meterpreter analysis. From that research it was found that interactive shell instances can be generated as pseudo-terminals with the command being piped through the master-slave files via the malicious agent. The use of pseudo-terminal is fairly rare from my analysis and so should always be flagged at some level due to its inherent capability to create a false secondary terminal instance controlled by a file association that is commonly overlooked (or not known about).
DUP
File duplication is a common activity in some other agent installations. During installation I have observed malicious agent binaries duplicating themselves within the same directory; this is unusual and should be easily flagged upon for a binary copying its own file instance. Also, one of the recurring elements in post-exploitation agents is the duplication of the agent's “ttysXXX” file multiple times during some operations to maintain terminal. This can be seen in MacShellSwift[12] for its fake prompt and persistence installation operations.
STAT
File stat checking is done in some operations to determine current availability of files which may already be in use by other applications. This was observed in only one case where the status of the file was checked on installation. This is a minor detection criterion that is likely only relative to very niche cases where file collisions are a concern for the agent, hence its low priority. This was seen in the MacShellSwift data.
RENAME
This event records all the file rename operations. In the MacShellSwift[12] installation, persistence and fake prompt operations displayed file rename operations. In the installation, this was the renaming of an “mdsDirectory.db_” to an “mdsDirectory.db” file (without the underscore); the persistence was a file with a seemingly pseudo random name being renamed within LauncherAgents to “com.user.provision.plist” which enables the persistence to fire on user login. The fake prompt was the alteration of a “functions.list.tmp” to a non tmp format. Although the latter conforms to some SYSTEM activity that is known to occur, the first two operations can be patterned for, especially the LauncherAgent renaming operation.
SETMODE
This event is the result of changing the access permissions of a file via a utility such as chmod. As binaries uploaded to a host will most likely need the permissions altered to allow for execution, or in the case of pulled from the internet the Q bit removed, this operation is almost inevitable in any malicious operations at some point. Due to this, patterning detection based on file alteration from non-standard binaries (non /bin/bash, Xcode for developers, cfprefsd daemon etc.) is likely to generate few outputs with a high probability that when an event is triggered it will have an anomalous origin (albeit not necessarily malicious).
SETEXTATTR
This event records all operations related to setting extended file attributes. This was seen in cases where file collisions were again possible, in this case related to the fake prompt operation within the MacShellSwift[12] framework. The agent would set the attribute of several osascript list files “com.apple.runningboard.can-suspend-locked”. Runningboard daemon is the successor to Assertions daemon, and deals with application preferences and resource allocation. Typically, this activity is only seen in development machines. In the case of MacShellSwift, this can be seen when it attempts to masquerade as a production binary. This type of behaviour can be mapped and can provide insight into how a malicious tool is trying to handle SYSTEM errors in order not to alert the user (or cause a system crash which is likely without).
Final notes on use of ESF telemetry
As there are 51 NOTIFY event types (89 event types in total) defined in “MacOSX10.15.sdk”, there are several event types that have not been added to this list. From my analysis, the omitted event types did not generate useful data to detect anomalous behaviour or produced no output whatsoever (other than that of the SYSTEM processes/daemons). As such, I aimed to provide an overview of the most valuable data types from the analysis conducted. That said, this analysis is not conclusive.
Disregarding the fidelity issue against production environment data, this analysis was conducted against post-exploitation frameworks only. These tools tend not to use complex workaround or exploitative features as they are employed after those operations have occurred. Therefore, the event types that are relevant for post-exploitation detection may not be useful when used to detect exploitation or other malicious code. Although I believe several recommended event types above will have overlap, without integration of the majority of the event types available there is always the potential for valuable data points to be lost. Yet, without conducting the analysis to prove an event type is important to the detection of a specific malicious activity there is an inherent risk of ignorance.
ESF Event types full list as of SDK 10.15
    ES_EVENT_TYPE_AUTH_EXEC

    ES_EVENT_TYPE_AUTH_OPEN
    ES_EVENT_TYPE_AUTH_KEXTLOAD
    ES_EVENT_TYPE_AUTH_MMAP
    ES_EVENT_TYPE_AUTH_MPROTECT
    ES_EVENT_TYPE_AUTH_MOUNT
    ES_EVENT_TYPE_AUTH_RENAME
    ES_EVENT_TYPE_AUTH_SIGNAL
    ES_EVENT_TYPE_AUTH_UNLINK
    ES_EVENT_TYPE_NOTIFY_EXEC
    ES_EVENT_TYPE_NOTIFY_OPEN
    ES_EVENT_TYPE_NOTIFY_FORK
    ES_EVENT_TYPE_NOTIFY_CLOSE
    ES_EVENT_TYPE_NOTIFY_CREATE
    ES_EVENT_TYPE_NOTIFY_EXCHANGEDATA
    ES_EVENT_TYPE_NOTIFY_EXIT
    ES_EVENT_TYPE_NOTIFY_GET_TASK
    ES_EVENT_TYPE_NOTIFY_KEXTLOAD
    ES_EVENT_TYPE_NOTIFY_KEXTUNLOAD
    ES_EVENT_TYPE_NOTIFY_LINK
    ES_EVENT_TYPE_NOTIFY_MMAP
    ES_EVENT_TYPE_NOTIFY_MPROTECT
    ES_EVENT_TYPE_NOTIFY_MOUNT
    ES_EVENT_TYPE_NOTIFY_UNMOUNT
    ES_EVENT_TYPE_NOTIFY_IOKIT_OPEN
    ES_EVENT_TYPE_NOTIFY_RENAME
    ES_EVENT_TYPE_NOTIFY_SETATTRLIST
    ES_EVENT_TYPE_NOTIFY_SETEXTATTR
    ES_EVENT_TYPE_NOTIFY_SETFLAGS
    ES_EVENT_TYPE_NOTIFY_SETMODE
    ES_EVENT_TYPE_NOTIFY_SETOWNER
    ES_EVENT_TYPE_NOTIFY_SIGNAL
    ES_EVENT_TYPE_NOTIFY_UNLINK
    ES_EVENT_TYPE_NOTIFY_WRITE
    ES_EVENT_TYPE_AUTH_FILE_PROVIDER_MATERIALIZE
    ES_EVENT_TYPE_NOTIFY_FILE_PROVIDER_MATERIALIZE
    ES_EVENT_TYPE_AUTH_FILE_PROVIDER_UPDATE
    ES_EVENT_TYPE_NOTIFY_FILE_PROVIDER_UPDATE
    ES_EVENT_TYPE_AUTH_READLINK
    ES_EVENT_TYPE_NOTIFY_READLINK
    ES_EVENT_TYPE_AUTH_TRUNCATE
    ES_EVENT_TYPE_NOTIFY_TRUNCATE
    ES_EVENT_TYPE_AUTH_LINK
    ES_EVENT_TYPE_NOTIFY_LOOKUP
    ES_EVENT_TYPE_AUTH_CREATE
    ES_EVENT_TYPE_AUTH_SETATTRLIST
    ES_EVENT_TYPE_AUTH_SETEXTATTR
    ES_EVENT_TYPE_AUTH_SETFLAGS
    ES_EVENT_TYPE_AUTH_SETMODE
    ES_EVENT_TYPE_AUTH_SETOWNER
    ES_EVENT_TYPE_AUTH_CHDIR
    ES_EVENT_TYPE_NOTIFY_CHDIR
    ES_EVENT_TYPE_AUTH_GETATTRLIST
    ES_EVENT_TYPE_NOTIFY_GETATTRLIST
    ES_EVENT_TYPE_NOTIFY_STAT
    ES_EVENT_TYPE_NOTIFY_ACCESS
    ES_EVENT_TYPE_AUTH_CHROOT
    ES_EVENT_TYPE_NOTIFY_CHROOT
    ES_EVENT_TYPE_AUTH_UTIMES
    ES_EVENT_TYPE_NOTIFY_UTIMES
    ES_EVENT_TYPE_AUTH_CLONE
    ES_EVENT_TYPE_NOTIFY_CLONE
    ES_EVENT_TYPE_NOTIFY_FCNTL
    ES_EVENT_TYPE_AUTH_GETEXTATTR
    ES_EVENT_TYPE_NOTIFY_GETEXTATTR
    ES_EVENT_TYPE_AUTH_LISTEXTATTR
    ES_EVENT_TYPE_NOTIFY_LISTEXTATTR
    ES_EVENT_TYPE_AUTH_READDIR
    ES_EVENT_TYPE_NOTIFY_READDIR
    ES_EVENT_TYPE_AUTH_DELETEEXTATTR
    ES_EVENT_TYPE_NOTIFY_DELETEEXTATTR
    ES_EVENT_TYPE_AUTH_FSGETPATH
    ES_EVENT_TYPE_NOTIFY_FSGETPATH
    ES_EVENT_TYPE_NOTIFY_DUP
    ES_EVENT_TYPE_AUTH_SETTIME
    ES_EVENT_TYPE_NOTIFY_SETTIME
    ES_EVENT_TYPE_NOTIFY_UIPC_BIND
    ES_EVENT_TYPE_AUTH_UIPC_BIND
    ES_EVENT_TYPE_NOTIFY_UIPC_CONNECT
    ES_EVENT_TYPE_AUTH_UIPC_CONNECT
    ES_EVENT_TYPE_AUTH_EXCHANGEDATA
    ES_EVENT_TYPE_AUTH_SETACL
    ES_EVENT_TYPE_NOTIFY_SETACL
    ES_EVENT_TYPE_NOTIFY_PTY_GRANT
    ES_EVENT_TYPE_NOTIFY_PTY_CLOSE
    ES_EVENT_TYPE_AUTH_PROC_CHECK
    ES_EVENT_TYPE_NOTIFY_PROC_CHECK
    ES_EVENT_TYPE_AUTH_GET_TASK
    ES_EVENT_TYPE_LAST
Sources
- https://github.com/Omar-Ikram
- https://bitbucket.org/xorrior/appmon/src/master/appmon/
- https://objective-see.com/products/utilities.html
- https://posts.specterops.io/detection-engineering-using-apples-endpoint-security-framework-affdbcb18b02
- https://www.fireeye.com/blog/threat-research/2020/03/crescendo-real-time-event-viewer-for-macos.html
- https://objective-see.com/blog/blog_0x48.html
- https://medium.com/red-teaming-with-a-blue-team-mentality/taking-the-macos-endpoint-security-framework-for-a-quick-spin-802a462dba06
- https://developer.apple.com/documentation/endpointsecurity
- https://objective-see.com/blog/blog_0x47.html
- https://developer.apple.com/support/kernel-extensions/
- https://developer.apple.com
- https://github.com/cedowens/MacShellSwift/tree/master/MacShellSwift
- https://github.com/BishopFox/sliver