Application-level Purple Teaming: A case study
By William Jardine on 29 September, 2020
Introduction
Attack-aware applications have been discussed in AppSec for over a decade - the concept that an application can detect that it is being attacked and fight back. However, the majority of organisations don't do this, or even the basics of detection and response for those apps, leaving a visibility gap on critical assets and a notable hole in detection and response strategies.
In our separate article on the 'Our Thinking' section of the F-Secure website, we discussed the history of attack-aware applications and our assessment of why this hasn't taken off. Specifically, we believe all of the current approaches (native code-level; tools-based using Web Application Firewalls (WAFs) and RASPs; anti-fraud techniques) are either lacking in coverage or are too effort-intensive. As such, we have instead been experimenting with an approach to introduce attack-awareness to apps in a more modular, iterative fashion, with application-level purple teaming.
In this post, we will walk through a case study where we performed this exercise against an existing application and the positive effect this had. This will include:
- Our identified metrics, categories and test cases.
- Details of the technology stack we used.
- Our defined rules for a few exemplar, high-fidelity alerts.
- Examples of quantifiable measures of the application's improved detection capability.
- Discussion of why some areas have not yet been focused on for detection, and why all areas have not been focused on for response.
This should provide useful insights for organisations similarly looking to review and improve the detection and response capabilities of their critical apps and enhance their resilience.
This approach is context-dependent and will involve collaboration from security, development and latterly detection and response/blue team members. However, the effort from each of these teams is generally short-term, and will variably involve each of them in specifically focused sprints. Throughout all of this, we have found that the general principles these activities should align to are:
- Iteration: Realised through focusing on different stages of the logging > alerting > responding journey, and on different test case categories.
- Categorization of test cases: Keeping the number of test cases small at first and splitting between a few common, relevant categories of attack. This ensures the focus is not just on "vulnerabilities", but also on other indicators such as misuse of legitimate functionality. High-level alignment to MITRE's ATT&CK framework can be used to demonstrate this approach's place within a broader detection and response strategy.
- Reuse of existing tools and systems: For example, tools such as Elasticsearch and Kibana for logging and alerting; the ModSecurity WAF for detection of specific injection-style issues; tools like ElastAlert may be key for bridging alerting and responding.
- Minimizing code changes: Little significant new coding should be necessary for logging and alerting; in our example, tools like ElastAlert should allow us to move into responsiveness with less coding effort than previously anticipated.
- Multi-app integration: This may involve integrating multiple back-end micro-services or separate logical applications. Each of these log sources should send to one centralised store (e.g. Elasticsearch, Splunk).
- Collaboration: Insight throughout from the security team is key, but the longer the exercise progresses, the more critical it is that the dev team (for early changes) and blue team (for later changes) drive things, both in terms of security learning and suggesting practical implementations.
The approach
Where AppSensor-style approaches to attack-aware applications have heavily focused at the code-level and on software security ways of working, our application-level purple teaming approach has sought to focus on iterative and collaborative approaches. This approach aligns further with detection and response team ways of working.
In general, purple teaming is the sharing of knowledge between offensive/red and defensive/blue teams; red teams emulating real-life attacker tactics, techniques and procedures (TTPs) and blue teams reviewing and enhancing their resilience. In that regard, the purple teaming we discuss in this article will be significantly different to expectations:
- We did not use attacker techniques defined in MITRE's ATT&CK, due to their general lack of applicability to applications.
- The quantity and sophistication of test cases we used was reduced, due to the lack of maturity in application-level detection and response compared to its infrastructure equivalent. Instead, a small number of high-fidelity test cases were used to identify the least effort, highest reward places to introduce logging and alerting.
- Rather than working with the detection and response team, we worked with the development team. First, we had to ensure robust fundamentals for logging were in place, which required an understanding of the specific application that the blue team wouldn't have. Strong logging fundamentals and exemplar alerting should be in-place first, to help the blue team step in and begin hunting for attacks with greater confidence.
The extent to which the above statements hold true, or to which the approach closer resembles a traditional purple team, is dependent on the existing level of sophistication within the app and the organisation.
Throughout our exercise, we were seeking to identify whether the application did each of the following:
- Log the presence of malicious indicators in a central, aggregated location to prioritise ease of querying and accuracy of data. This is also referred to as telemetry. Log data will vary in its provenance and in the attack types it can cover.
- Alert the appropriate staff to malicious indicators in that log data. Built on top of good log data, alerts can signal known bad indicators or multiple, individually benign log entries, which only together are suspicious; they needn't rely on a single event. This often utilises tools such as SIEMs (Security Information and Event Management) and visualisation dashboards.
- Respond to those alerts—whether manually, or automatically. Response (the concept that a target can fight back or protect itself from an attacker) is particularly interesting in the case of web applications. Often an organisation's most exposed assets, these could limit their own attack surface by taking steps to lock accounts, rate limit source IP addresses, or serve up fake data to deter further attacks.
Our general observations of client applications lead us to believe that a majority of large organisations collect some form telemetry from their applications. However, this is usually focused on activities such as detecting fraud, and not on security events. In general, security-focused alerting or response can therefore not exist, outside of out-of-the-box capabilities provided by tools like WAFs. Therefore, for most organisations, the first significant focus would likely be security-focused refinements to that logging. The focus should then shift to the introduction of exemplar, high-fidelity alerting, for the categories of attack relevant to the app and the organisation.
The application in our case study had little existing security-focused logging, and no existing alerting. Applications with sufficient existing logging and an established detection and response/blue team elsewhere in the business would likely start at a later stage than our case study - with further collaboration with the blue team, and the use of more numerous and sophisticated payloads.
This post describes our approach to application-level purple teaming for a specific app; yours would likely be different. We've started discussing this approach with a few different organisations, who each have different requirements and levels of sophistication. For this case study, the general flow looked like this:
- We first performed a threat modelling exercise to understand the app, its technology stack, the attackers who might target it, higher-likelihood attacks and existing controls. We used this to decide on baseline metrics we would need to capture, as well as the main categories and test cases we would benchmark the app against.
- In iteration #1, we focused on baselining the app's current attack-awareness, specifically its logging and alerting across our test cases.
- In iteration #2, we assessed the improvements to logging and alerting across those test cases, using common toolsets for this. At this stage, we also began considering what response could look like.
- In future, we will seek to close gaps in logging and alerting for remaining categories and start introducing responsiveness for those categories we've already covered.
Threat modelling - understanding the app
To explore the above, we worked with a client to identify a critical application as a proof-of-concept - a file sharing portal. The application allowed file uploads and downloads, with access controls limiting access to specific vendors and files. We considered attacks from two distinct user roles:
- Vendor: A user external to the organisation, limited to their own files. Authentication was via username and password. This role required Multi-Factor Authentication.
- Internal: A user from the organisation who could create, read, update and delete all files. Authentication was via federated ADFS authentication. This role required Multi-Factor Authentication.
The app had been pentested before as part of its development lifecycle, with some low and medium risk vulnerabilities identified, which had since been resolved. It is important to note that trying to find vulnerabilities was not the focus of the application-level purple team exercise; we should assume this work has already been undertaken, and focus our test cases on factors beyond just vulnerabilities, such as abuse of legitimate functionality. This is particularly true for internal users.
The application had a front-end AngularJS UI, with front and back proxies in place and multiple API micro-services. Each of those APIs and proxies performed logging, meaning we had the following log sources:
- Access logs: For each micro-service/API. Based on HTTP requests and responses served by the APIs.
- Audit logs: For each micro-service/API. Based on JSON objects explicitly logged by the APIs.
- Proxy logs: For both the front and back proxies, logging API routes requested and other factors which might not appear in either of the above log sources.
Early in the process, the developers identified to us that while reasonably verbose logs were maintained, they were not security-focused. Through this, they realised that most of the attacks we discussed with them would not be easily visible from those logs. Specifically, the following key threats and attacks were discussed:
- External, low-effort attacks, such as those attempting to exploit common web application vulnerabilities.
- External, low-effort attack indicators, such as using scanning tools or attempting denial of service attacks.
- External, low-effort attacks, such as user compromise attacks like credential stuffing, password brute-force or username enumeration.
- Malicious vendor users attempting to access files and vendors other than their own.
- Malicious internal users downloading large quantities of files.
- Any users attempting to upload malicious file types.
Generating our metrics, categories and test cases
Using the insights from this threat modelling, we produced a list of areas to focus our work on, alongside specific test cases. Throughout this post, we will reference the following terminology:
- Log aggregation and visualisation: Sending our log data to a centralised source, use of correlation IDs, logging timestamps and source IP addresses, etc.
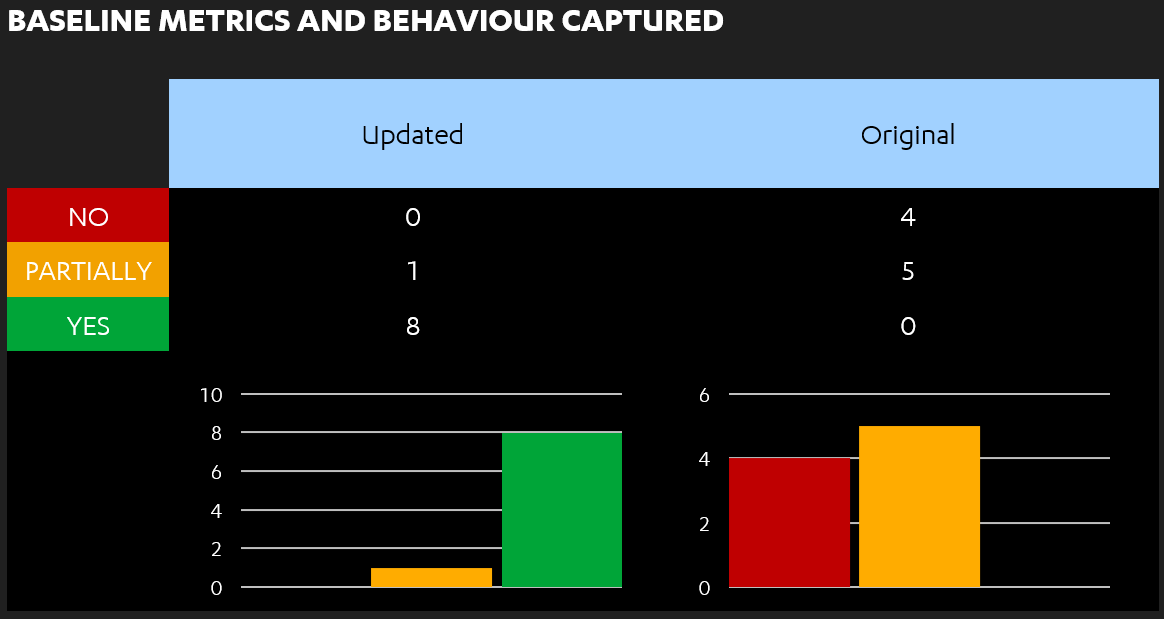
- Baseline metrics and behaviour: Key metrics and application health indicators, at a user-level and an application-level.
- Categories: The high-level groupings of our test cases.
- Test cases: Individual attacker actions or scenarios we want to log, alert and respond to.
Firstly, we agreed a range of key metrics we required visibility of with the client. Note, these are independent of our test case categories, as a broad underpinning to any application-level logging. To understand what malicious or anomalous behaviour looks like, it is critical to first understand general application load and user behaviour.
Baseline metrics and behaviour
What? - How the application behaves and monitors users and general application health metrics, split into login metrics and general request metrics. In general, we should focus on authenticated traffic, to avoid unnecessarily large data sets from common, low-effort attacks, such as those using automated tooling. While we might consider those attacks, we will probably arrive at the decision that it isn't cost-effective for us to want to be aware of them.
Metrics:
Login and user metrics:
- Source IP address
- Timestamp
- Number of successful logins
- Last login time
- Number of unsuccessful logins
- Number of OTP attempts
- Last login IP address and region
Request metrics:
- Requests per second/minute (for the application)
- Requests per second/minute (per-user)
~
For our categories and test cases, we were not seeking to align to a specific framework, nor to OWASP's AppSensor Detection Points or Top 10. At this point, that felt unnecessary; trying to solve a problem we weren't yet sophisticated enough to solve. Rather, our categories and test cases should be relevant to our identified threat model. As such, the following broad categories were identified:
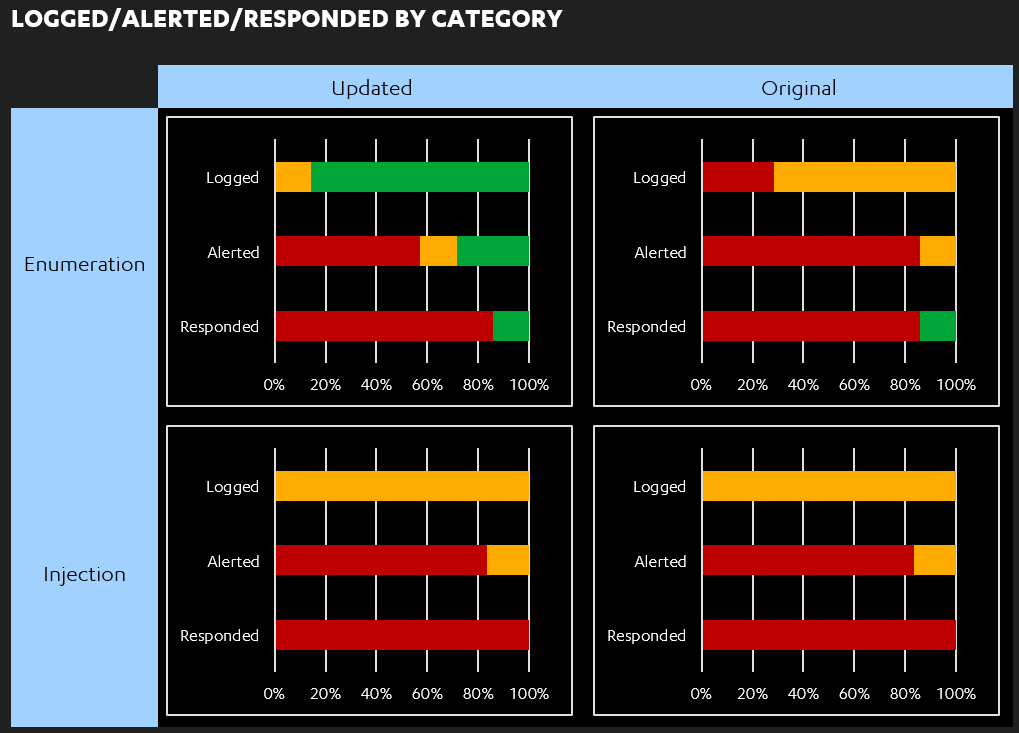
- Enumeration
- Injection
For each of those categories, we created between 5 and 10 test cases and sought to capture a yes/no/partially status across the logging > alerting > responding journey for each of them.
However, the MITRE ATT&CK framework is the industry-standard approach for categorising detection and response activities, so our work below will make reference to it. While there are not often direct mappings to ATT&CK attacker techniques, the high-level phases are analogous and can be beneficial in framing application-level efforts as part of a broader detection and response strategy. This is shown in the diagram below of F-Secure's adapted kill-chain, with those phases mapped onto ATT&CK ones beneath that:
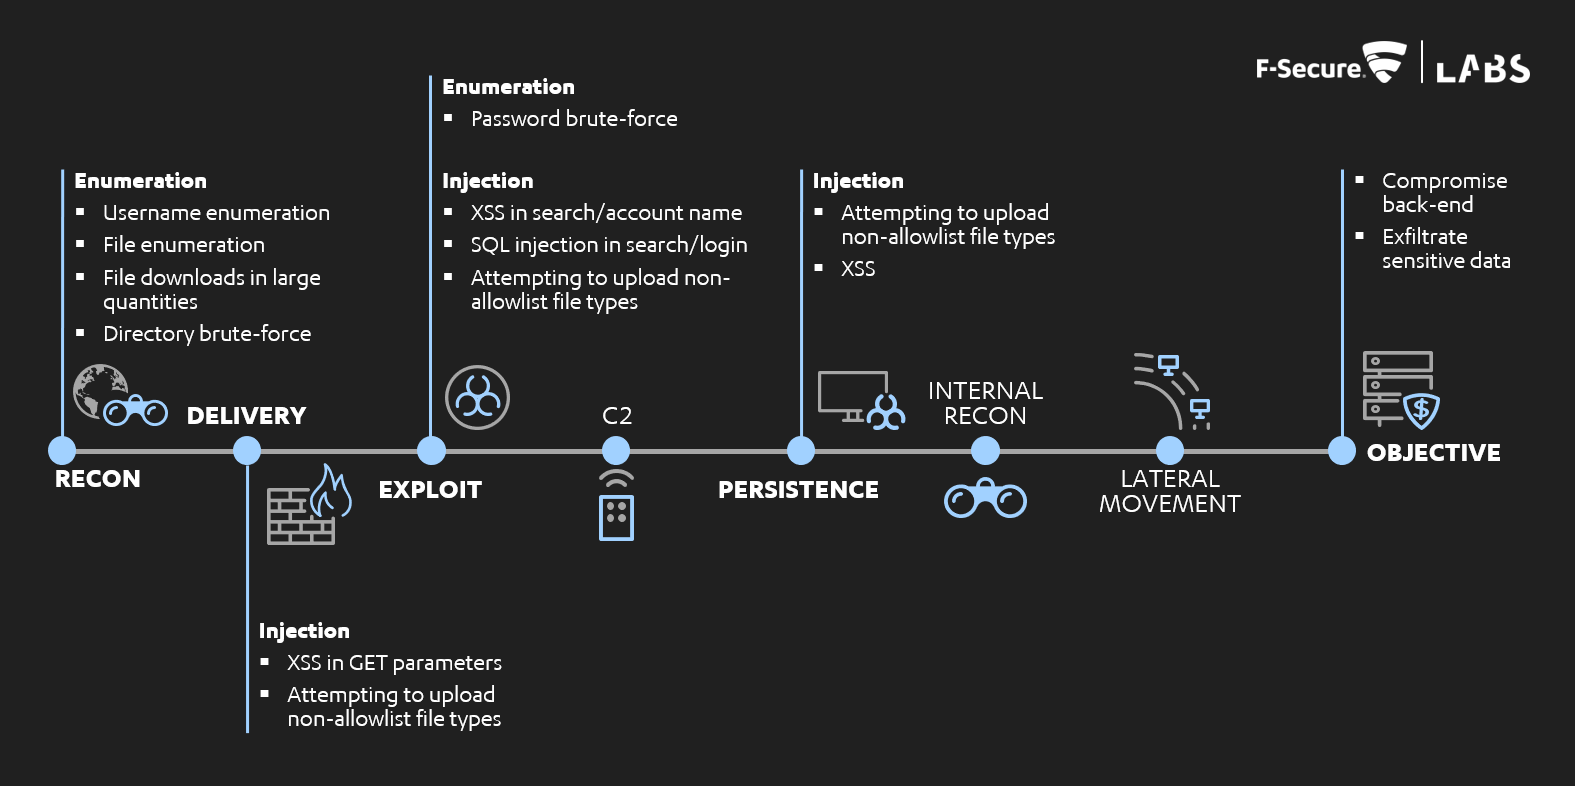
Where attacker activities would usually be detected in phases such as C2, persistence, internal reconnaissance and lateral movement, many of our actions here could be detected earlier.
Categories
Enumeration:
What? - Where users attempt to iterate through multiple files, objects, or users to violate access controls and perform privilege escalation.
Why? - Due to the app's purpose as a file sharing application, access control issues and enumeration of files, vendors and users were considered the most likely attacker actions.
Relevant MITRE ATT&CK phases: Discovery, Initial Access
Test cases:
- Username enumeration
- Password brute-force
- File enumeration
- Downloads of large quantities of files
- Account area enumeration
- User profile enumeration
- Directory brute-force
Injection:
What? - Where users attempt to manipulate application content and behaviour to compromise systems and users. This includes common vulnerabilities such as XSS and SQL injection.
Why? - This category encompasses the most commonly exploited web app vulnerabilities, such as those within the OWASP Top 10 and those attempted by automated tooling.
Relevant MITRE ATT&CK phases: Initial Access, Execution, Persistence
Test cases:
- Cross-Site Scripting in search
- Cross-Site Scripting in account name
- Cross-Site Scripting in GET parameter
- SQL injection in search
- SQL injection in login
- Attempting to upload unexpected/unintended file types
Whether these test cases were initially logged or alerted is described in iteration #1; improvement activities were then carried out by the development team and validated in iteration #2.
Iteration #1 - reviewing existing logging and suggesting alerting
Log aggregation and visualisation
The 3 application log sources identified in our threat modelling contained indicators which could help with logging and alerting malicious actions across our test cases, but often missed useful metrics such as timestamps or source IP addresses. The combination of that and a lack of correlation and request IDs would make it difficult to correlate user actions and trace events - whether malicious or benign.
All of these logs (both at an application-level and a proxy-level) were also only visible if viewing the log files on their respective hosts - they were not aggregated to a centralised source to allow using it as one app-wide dataset.
Baseline metrics and behaviour
Several of our key login and request metrics were partially visible from the logs, but often only implicitly. For example, login events were visible via the relevant "/login" HTTP requests, but counts of those login events were not maintained. Timestamps and source IP addresses were frequently not visible, meaning it would be difficult to trace those events or identify when or from where a user had logged in.
A number of logical issues were identified at the code-level which prevented thorough logging of failed logins or OTP attempts. For example, a failed login counter was incremented, with accounts locked when it reached 5. However, that counter included both username/password and OTP failures, meaning it was not possible to differentiate between the two, nor identify whether a user had eventually gained account access. The value was also reset to 0 once an account was unlocked, meaning the total number of historical account lockouts or failed logins could not be counted.
The application was not capable of maintaining a count of overall requests to it, either on a per-user level or across the application as a whole. To properly identify peaks in traffic, potential denial of service attacks or many other suspicious indicators, it is critical to first understand what healthy application traffic looks like.
Due to the aggregation and visualisation issues described above, there was no central source of this log data, nor a way of visualising it and any resultant alerts.
Enumeration
As a file transfer application with multiple distinct user roles, a majority of our enumeration test cases focused on enumerating valid files and user profiles. This encompassed both of:
- Access control violations: i.e. trying to access a specific file or profile.
- Brute-force attempts: i.e. enumeration through large quantities of files or profiles.
The majority of our enumeration test cases were partially visible in the logs, but without sufficient detail (such as timestamps and source IPs). No alerting was present. The only response was account lockout when password brute-force attempts were performed - this is arguably the best understood example of an attack-aware application and the one most organisations likely have in-place.
Interestingly, while username enumeration and password spraying attempts were handled by the application through preventative controls, no detective controls were present. Unsuccessful login attempts may be logged, but due to the lack of timestamps and source IP addresses, it was not possible to identify if multiple usernames had been attempted from the same source in a given time period.
Access control issues such as file enumeration and user profile enumeration were partially visible by the presence of key indicators such as HTTP 403 and 404 responses. However, due to the variation in those indicators, this could not be reliably used to identify any access control violations. Alerting based solely on a 403 or 404 would lack granularity of the cause of the malicious activity and would present little benefit to anyone triaging the logs; other factors such as the API controller responding could help clarify the cause of the response code. Multiple variances of enumeration were attempted to map out the resultant HTTP responses and indicators for this app.
As the internal user role was intended to access all files across all vendors, no file enumeration access control violations would occur. In this case, suspicious behaviour may include a user downloading a high quantity of files in a given time period (e.g. 100 files in an hour), rather than 403 responses. This would therefore not be flagged explicitly in the logs, but could be inferred from maintaining a count of such events per-user.
Directory brute-force attempts are traditionally indicated by HTTP 404 responses. However, with JavaScript front-ends supported by back-end APIs, this is non-trivial to identify. Some traditional "server-side 404s" may occur if API paths (e.g. https://www.example.com/api/v1/user1) were enumerated. However, many "client-side 404s" visually displayed a 404 to the user due to the lack of an API route (e.g. https://www.example.com/users), but neither generated a 404 response nor appeared in the server logs; rather 200 responses with "404" in the response body were visible in the proxy logs.
Injection
The test cases we used for this category encompassed basic examples of these types of attacks. As expected, all were partially logged (i.e. technically visible in logs, but not explicitly flagged, and lacking timestamps and detailed information), with none alerted or responded to. There was also no in-built rulesets to help detect a broad range of payloads.
Notably, the detection and prevention of these specific attack types (e.g. Cross-Site Scripting, SQL injection) has been the area most frequently outsourced to tools such as WAFs in the past.
Iteration #2 - reviewing updated logging and alerting; further alerting sprints
Log aggregation and visualisation
Following iteration #1, the organisation decided on use of the ELK stack (Elasticsearch, Logstash, Kibana), to be consistent with use throughout the team and business. Therefore, a majority of logs were now sent to Logstash, to then be aggregated into various Elasticsearch indexes. That log data was sorted and queried in Elasticsearch, which could be used to look for key indicators, aided greatly by the increased presence of timestamps and source IP addresses.
At the suggestion of the dev team, the Yelp tool ElastAlert was used to help perform alerting. ElastAlert builds on top of Elasticsearch queries, which allowed the team to query the log data with Elastic, and then perform a match based on those query results. If those query results weren't sufficient, this also supported "match enhancements" to perform a second query based on the results of the first - for example:
- A query for 404 responses may return a request ID, but not the user's ID.
- A match enhancement could be created to take that request ID and map it to its corresponding user ID.
- These enhancements are short, custom Python scripts and can use one of several data sources - Elasticsearch, IP address geo-enrichments, app-specific data, etc.
ElastAlert rules themselves are defined via YAML files, some of which are shown below. These YAML definitions may or may not reference match enhancements or built-in ElastAlert rules. In our example, we created or used rules for enumeration attempts, user lockouts and failed and successful logins. ElastAlert was then used to send all of the logs and any rule hits to the Kibana visualisation tool. Additionally, the Sigma tool supports compilation to ElastAlert, which would enable tool-agnostic creation of rules for the app.
A key benefit of this approach was that all of our log data was visible in Kibana, not just known-bad alerts. This would later allow detection and response teams to hunt through legitimate user activity and events surrounding alerts, similar to how they function in infrastructure detection and response.
In Kibana, the dev team created the following "Dashboards" to monitor, as well as the raw log data in the "Discover" tab:
- Alerts: Lists all explicit alerts, based on ElastAlert rules.
- Audit logs: Lists all audit log events.
- Log ons: Aggregated data, metrics and events for user authentication, login failure, locked-out accounts, etc.
- Metrics: Aggregated data and metrics on application load and activity for the application, including the underlying Rails APIs.
Examples of powerful Kibana views for some of our test cases and attack types are visible below.
No approach for response to any detected test cases was yet defined. At this point, it was deemed premature to discuss this with the team.
Baseline metrics and behaviour
Incremental changes to the data the application logged and proper aggregation to Elasticsearch and Kibana meant that our baseline metrics were much more visible. We could see key requests and responses for relevant user behaviour in Kibana, which could be used as the basis for high-fidelity alerting.
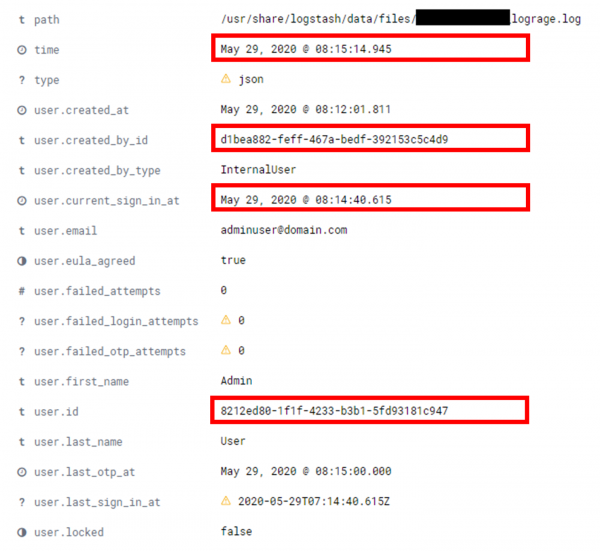
Account lockout actions were visible in our "Audit logs" Kibana dashboard, with key identifiers highlighted:
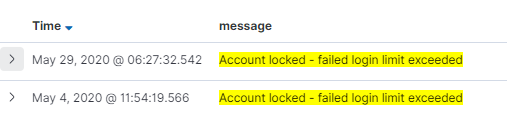
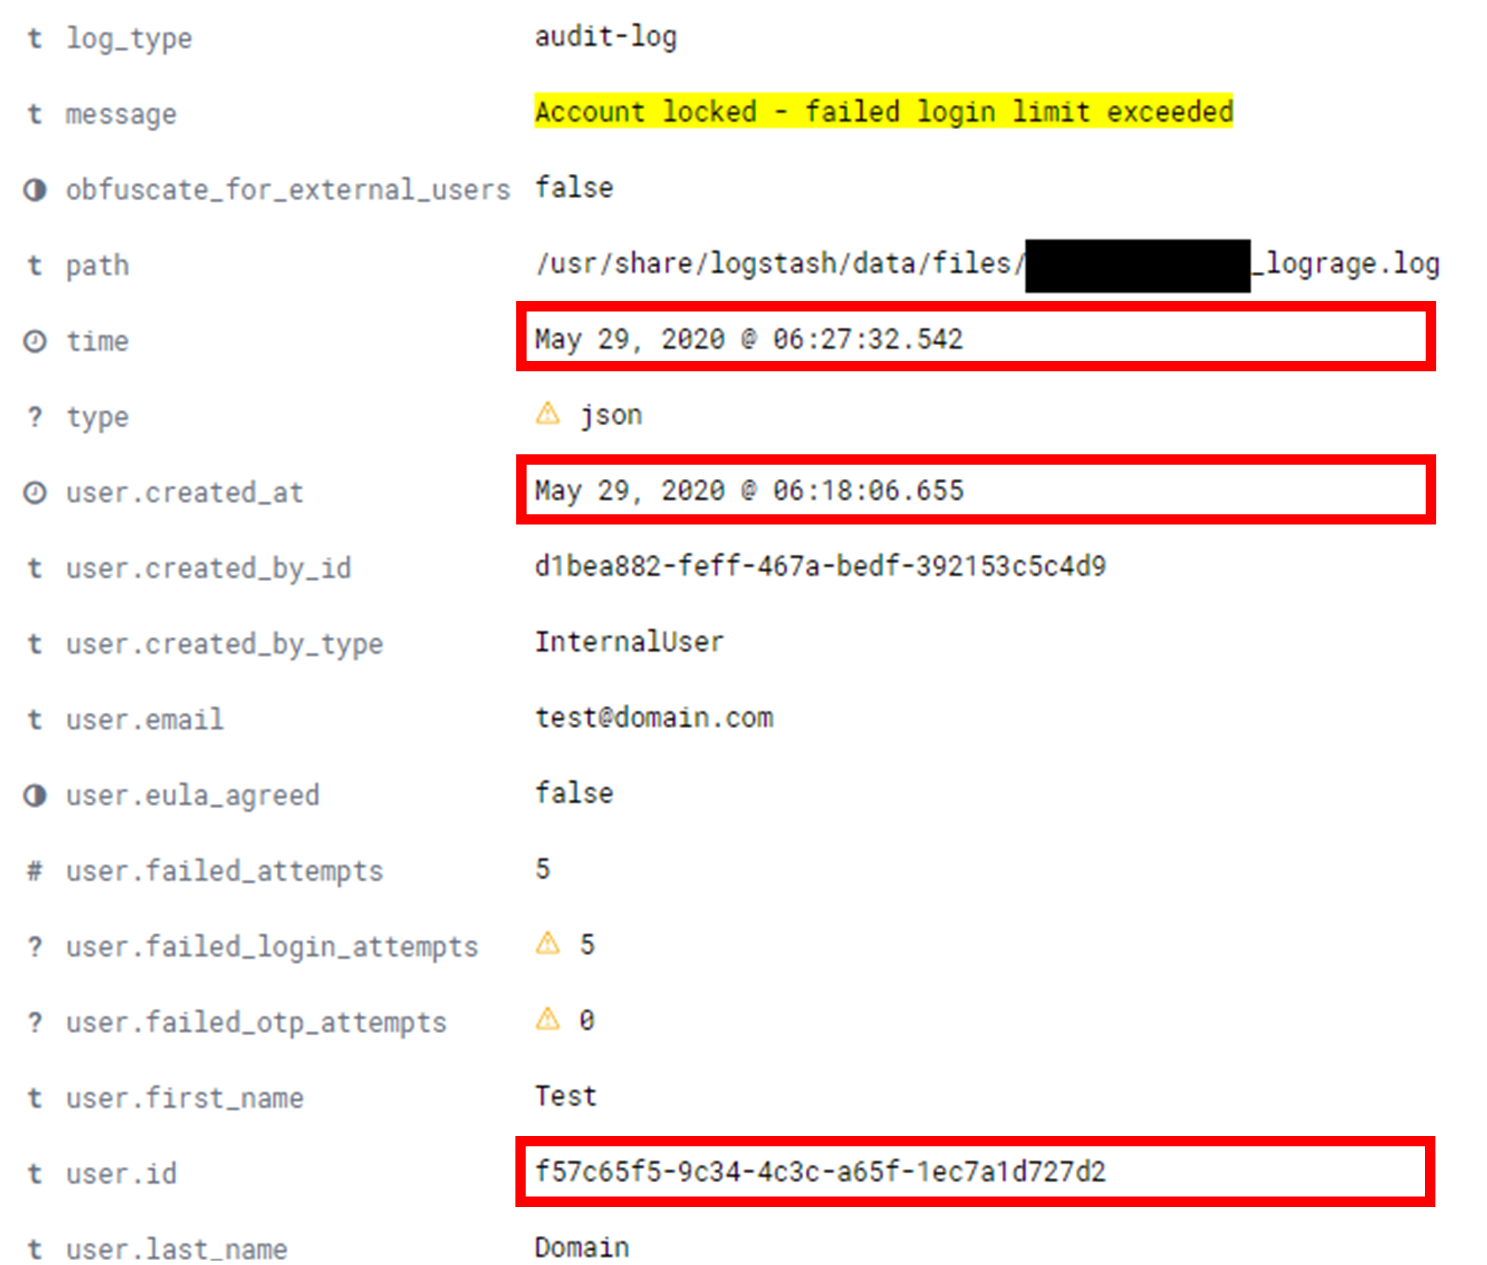
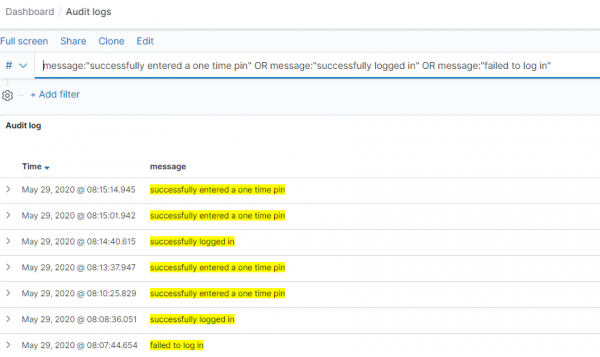
Teams using Kibana could identify the request ID or user ID in question and view all logs related to that. This would allow detection and response teams to identify any other linked attacks or anomalous activity. For example, all successful login events, OTPs and other conditions were visible in the "Audit logs" dashboard:
Further login-related metrics were summarised in the "Log ons" dashboard:
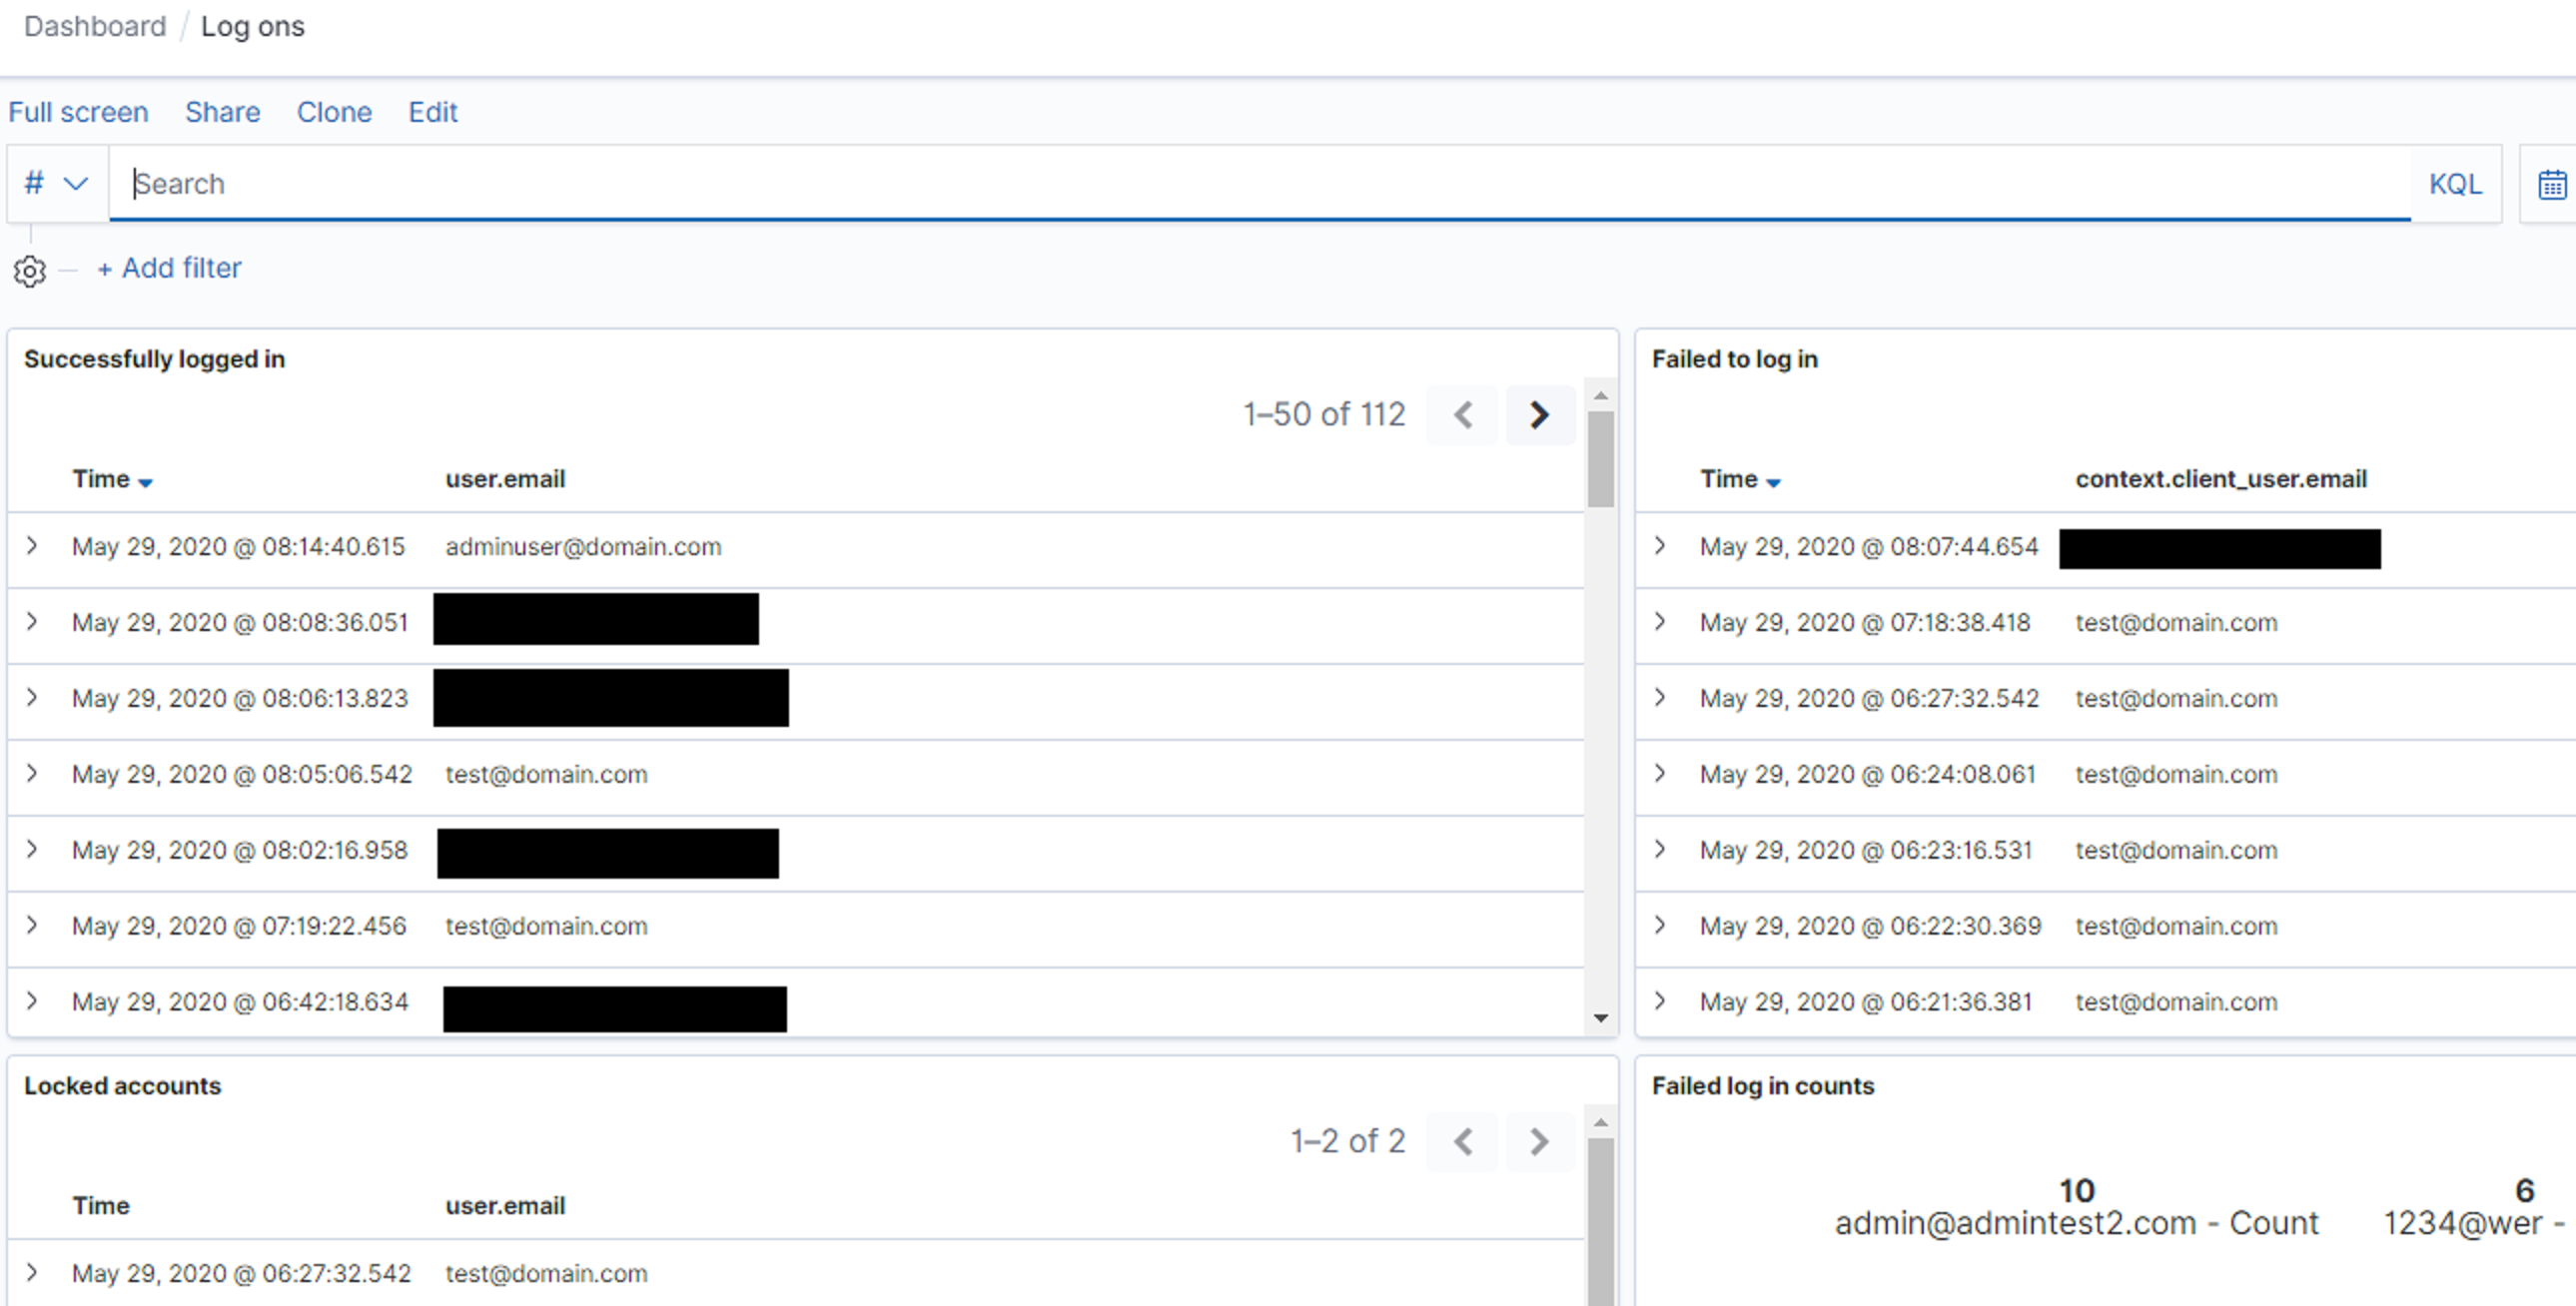
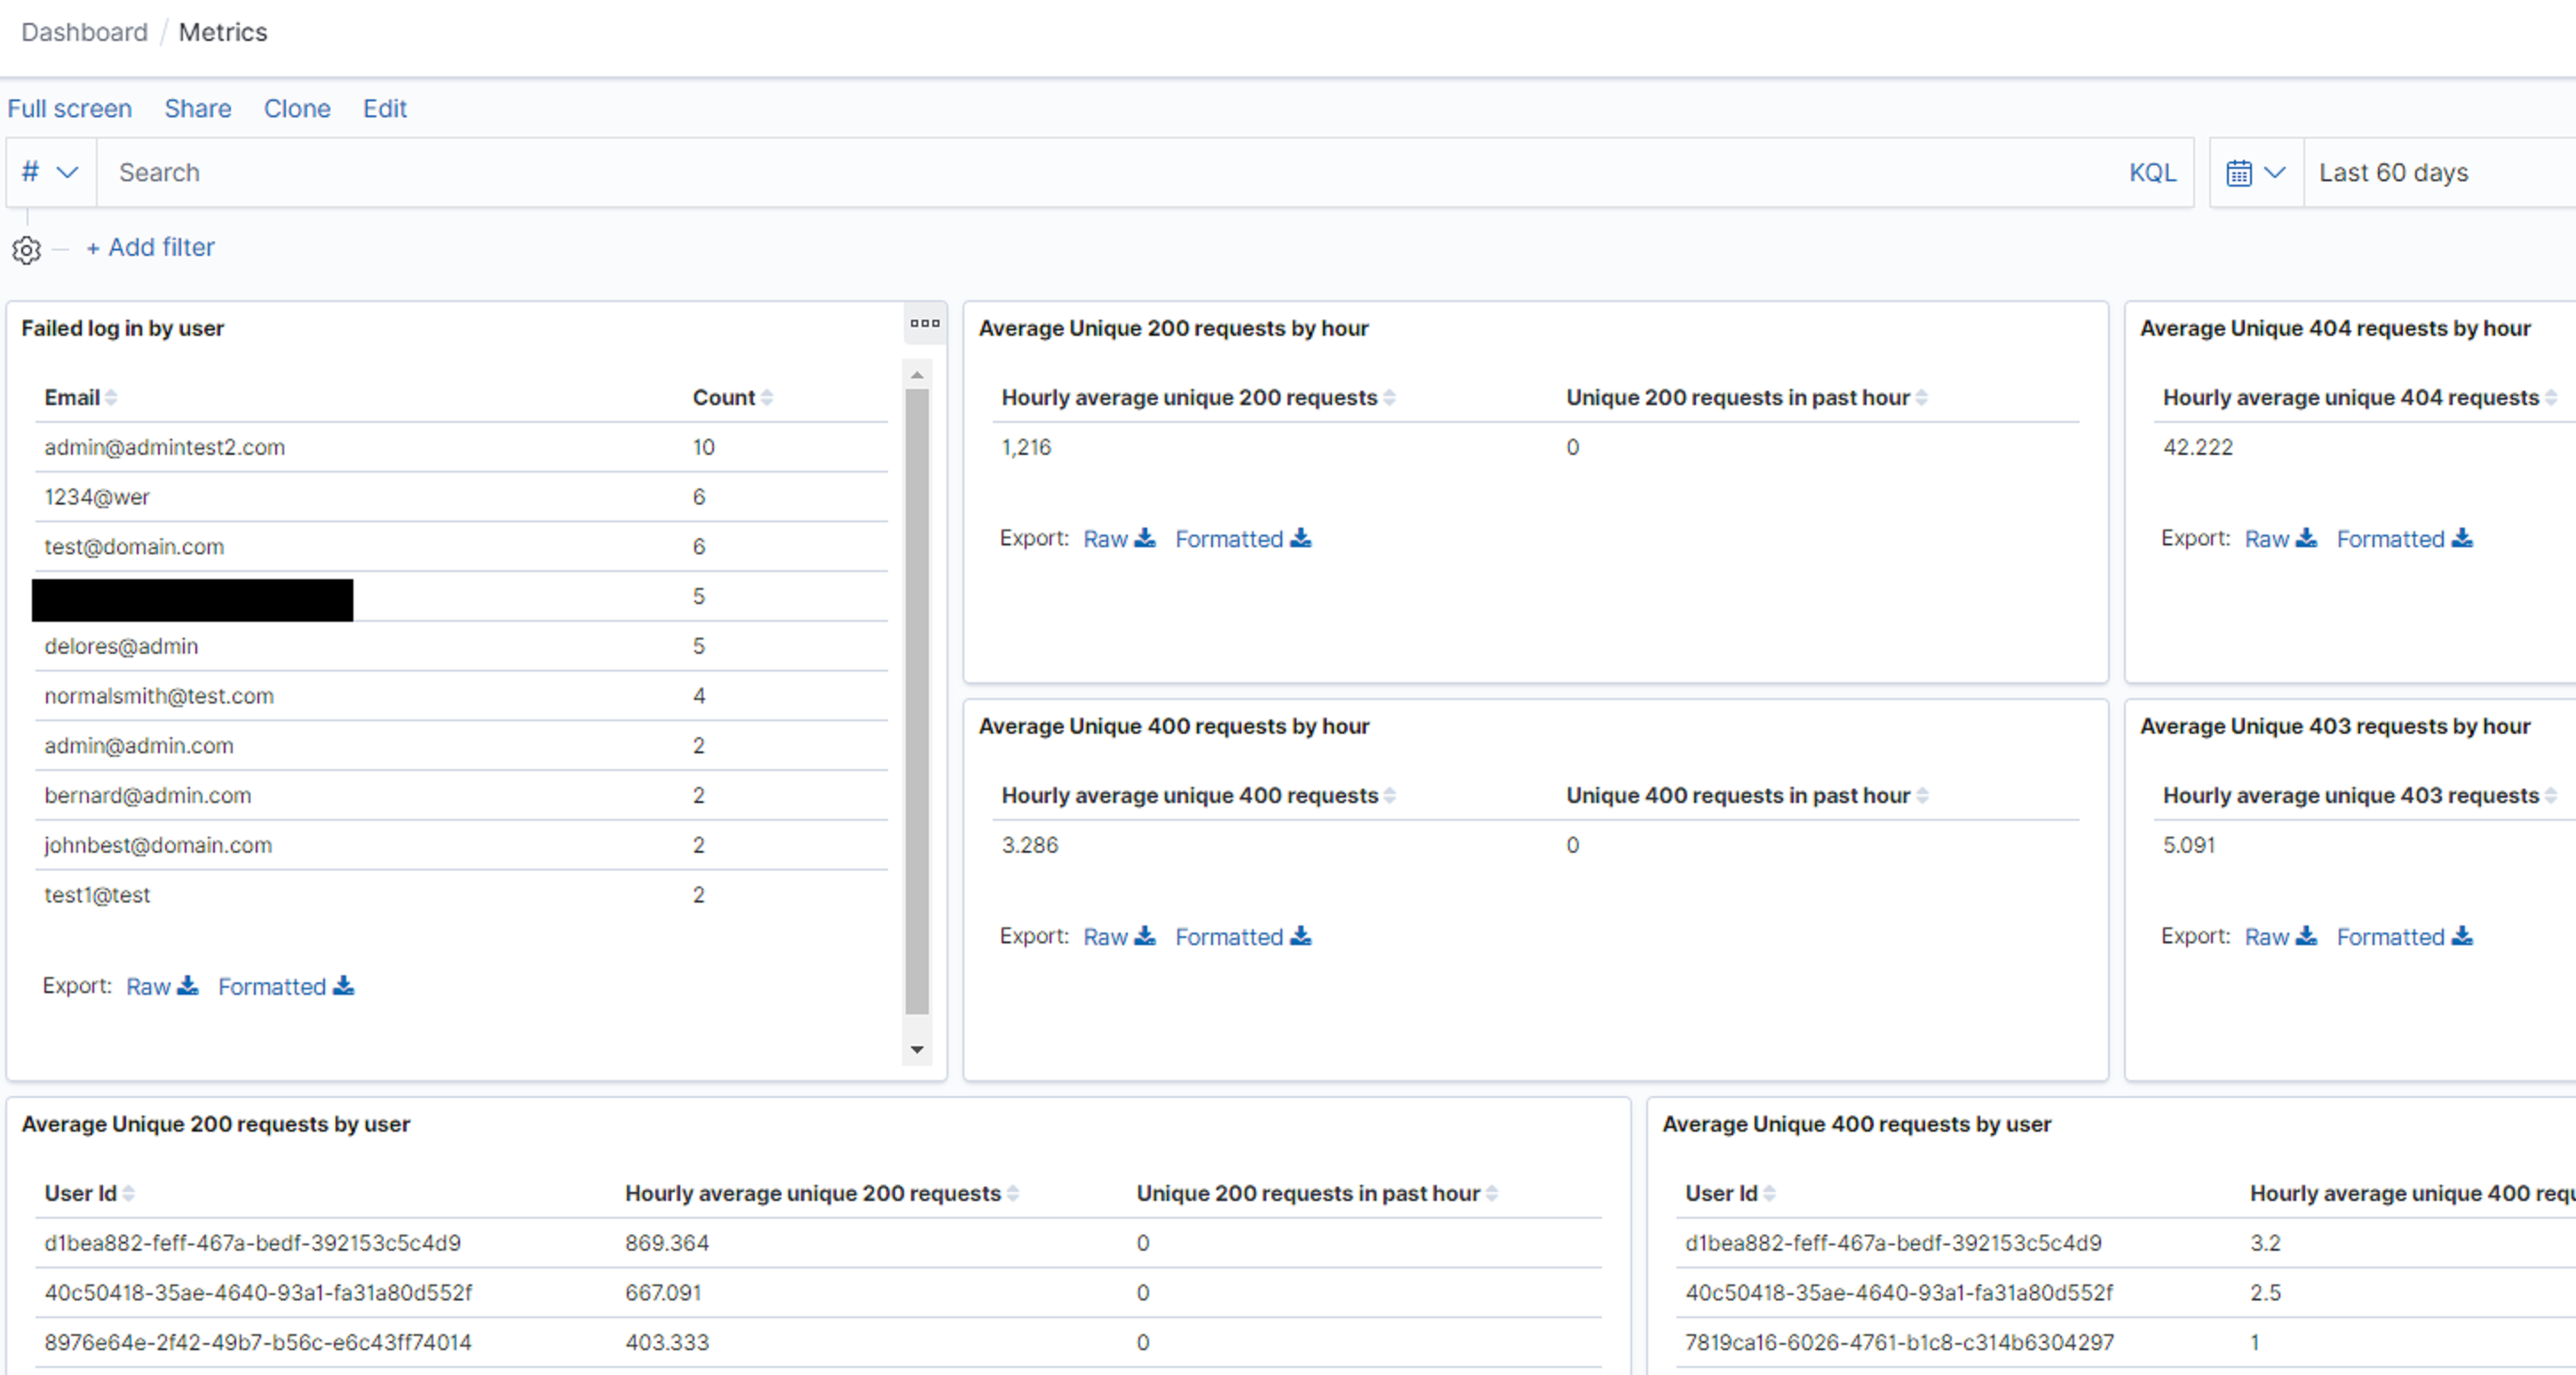
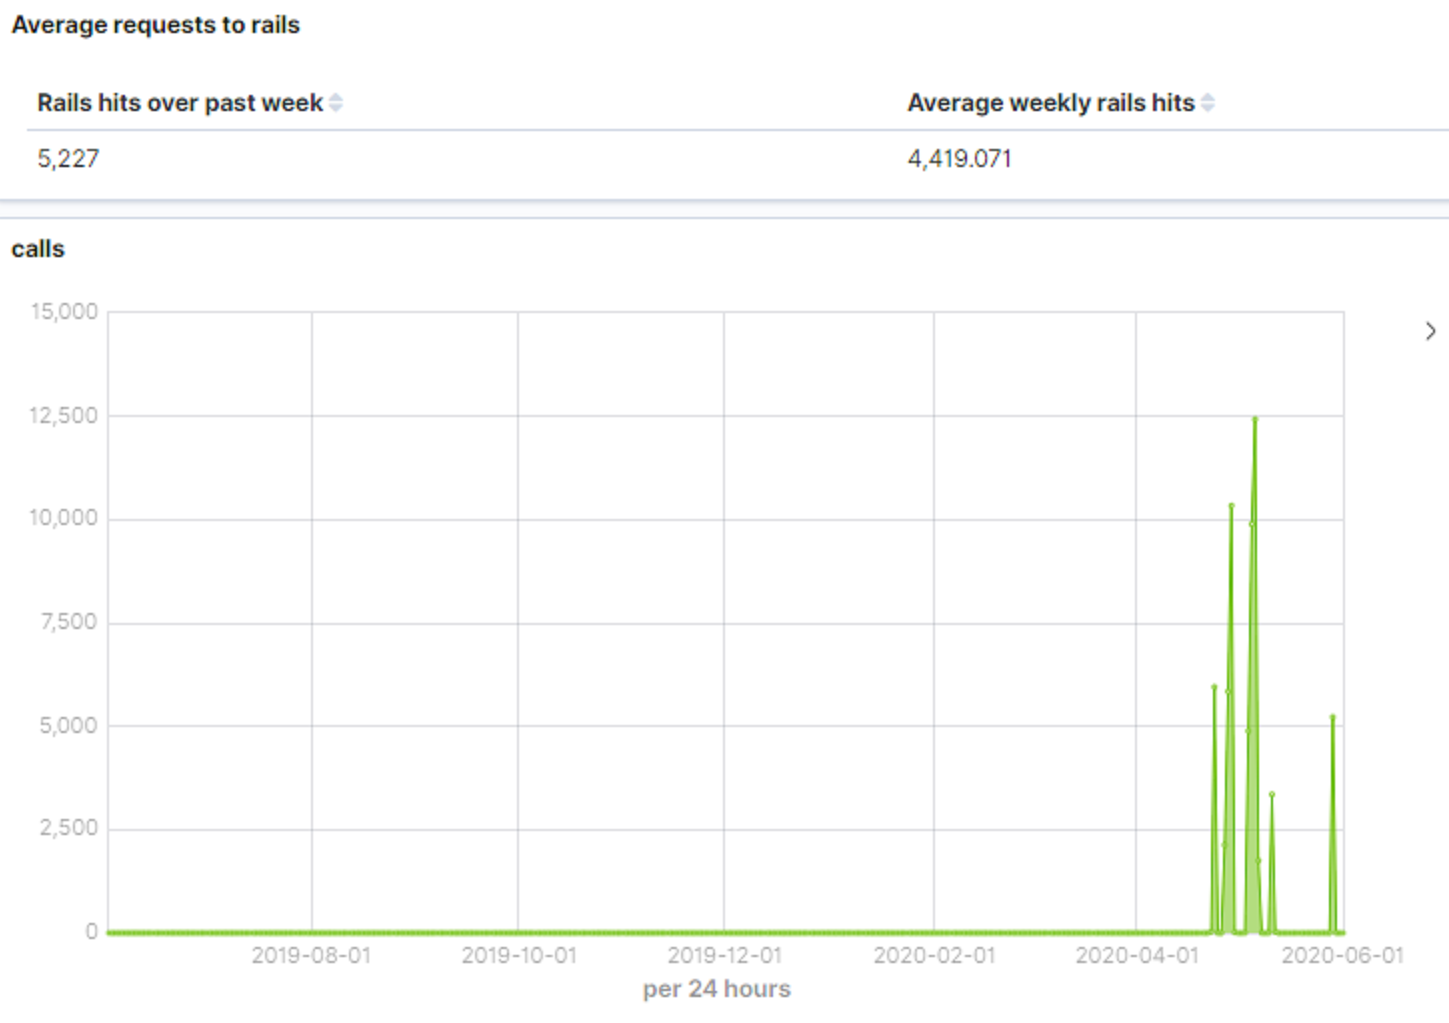
This provided detailed insight into our login-related metrics, such as who logged in when, and counts of both successful and failed logins. Request-related metrics were also visible, in the "Metrics" dashboard. This could be used to identify expected traffic over a given time period, as well as actual traffic, filtered by individual users and HTTP response codes:
This analysis was performed offline - i.e. in Elasticsearch, ElastAlert and Kibana - meaning the application was unaware of login alerts or request metrics. As such, response could not yet be achieved. In iteration #1, we had discussed a long-term plan for this with the developers: to introduce AppSensor-style code-level logic, so the application was natively aware of attacks to respond to. However, this was not our preferred solution, due to the perceived high amount of coding effort involved there, which would was seen as at odds with functional development. During iteration #2, the dev team suggested that they could instead use ElastAlert and webhooks to send rule hits to the app itself, rather than just to Kibana. Those webhooks could then reuse existing application functionality to appropriately respond.
Further incremental recommendations included new test cases we could assess, new alert categories, refinements to the Kibana dashboards and displaying source IP and login time to the end user.
Enumeration
All of the test cases identified for this category now generated log data, which was stored in Elasticsearch and visible in Kibana. A small number of exemplar, high-fidelity alerts were also created as a result of that logging. No improvement in response had been attempted, as this was not yet our focus.
The log data's presence in Elasticsearch allowed us to query aggregated data over specific time periods. The dev team established set thresholds for certain attack indicators to generate alerts from, such as more than 5 files downloaded by an internal user in an hour, or more than 5 403s occurring in a 5-minute period. This allowed the creation of a small number of enumeration alerts:
- Alerting on specific 403 and 404 responses as a file download access control violation.
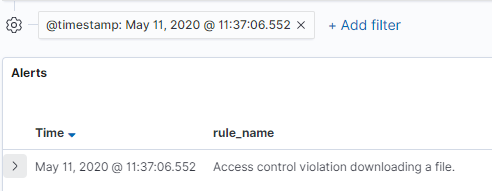
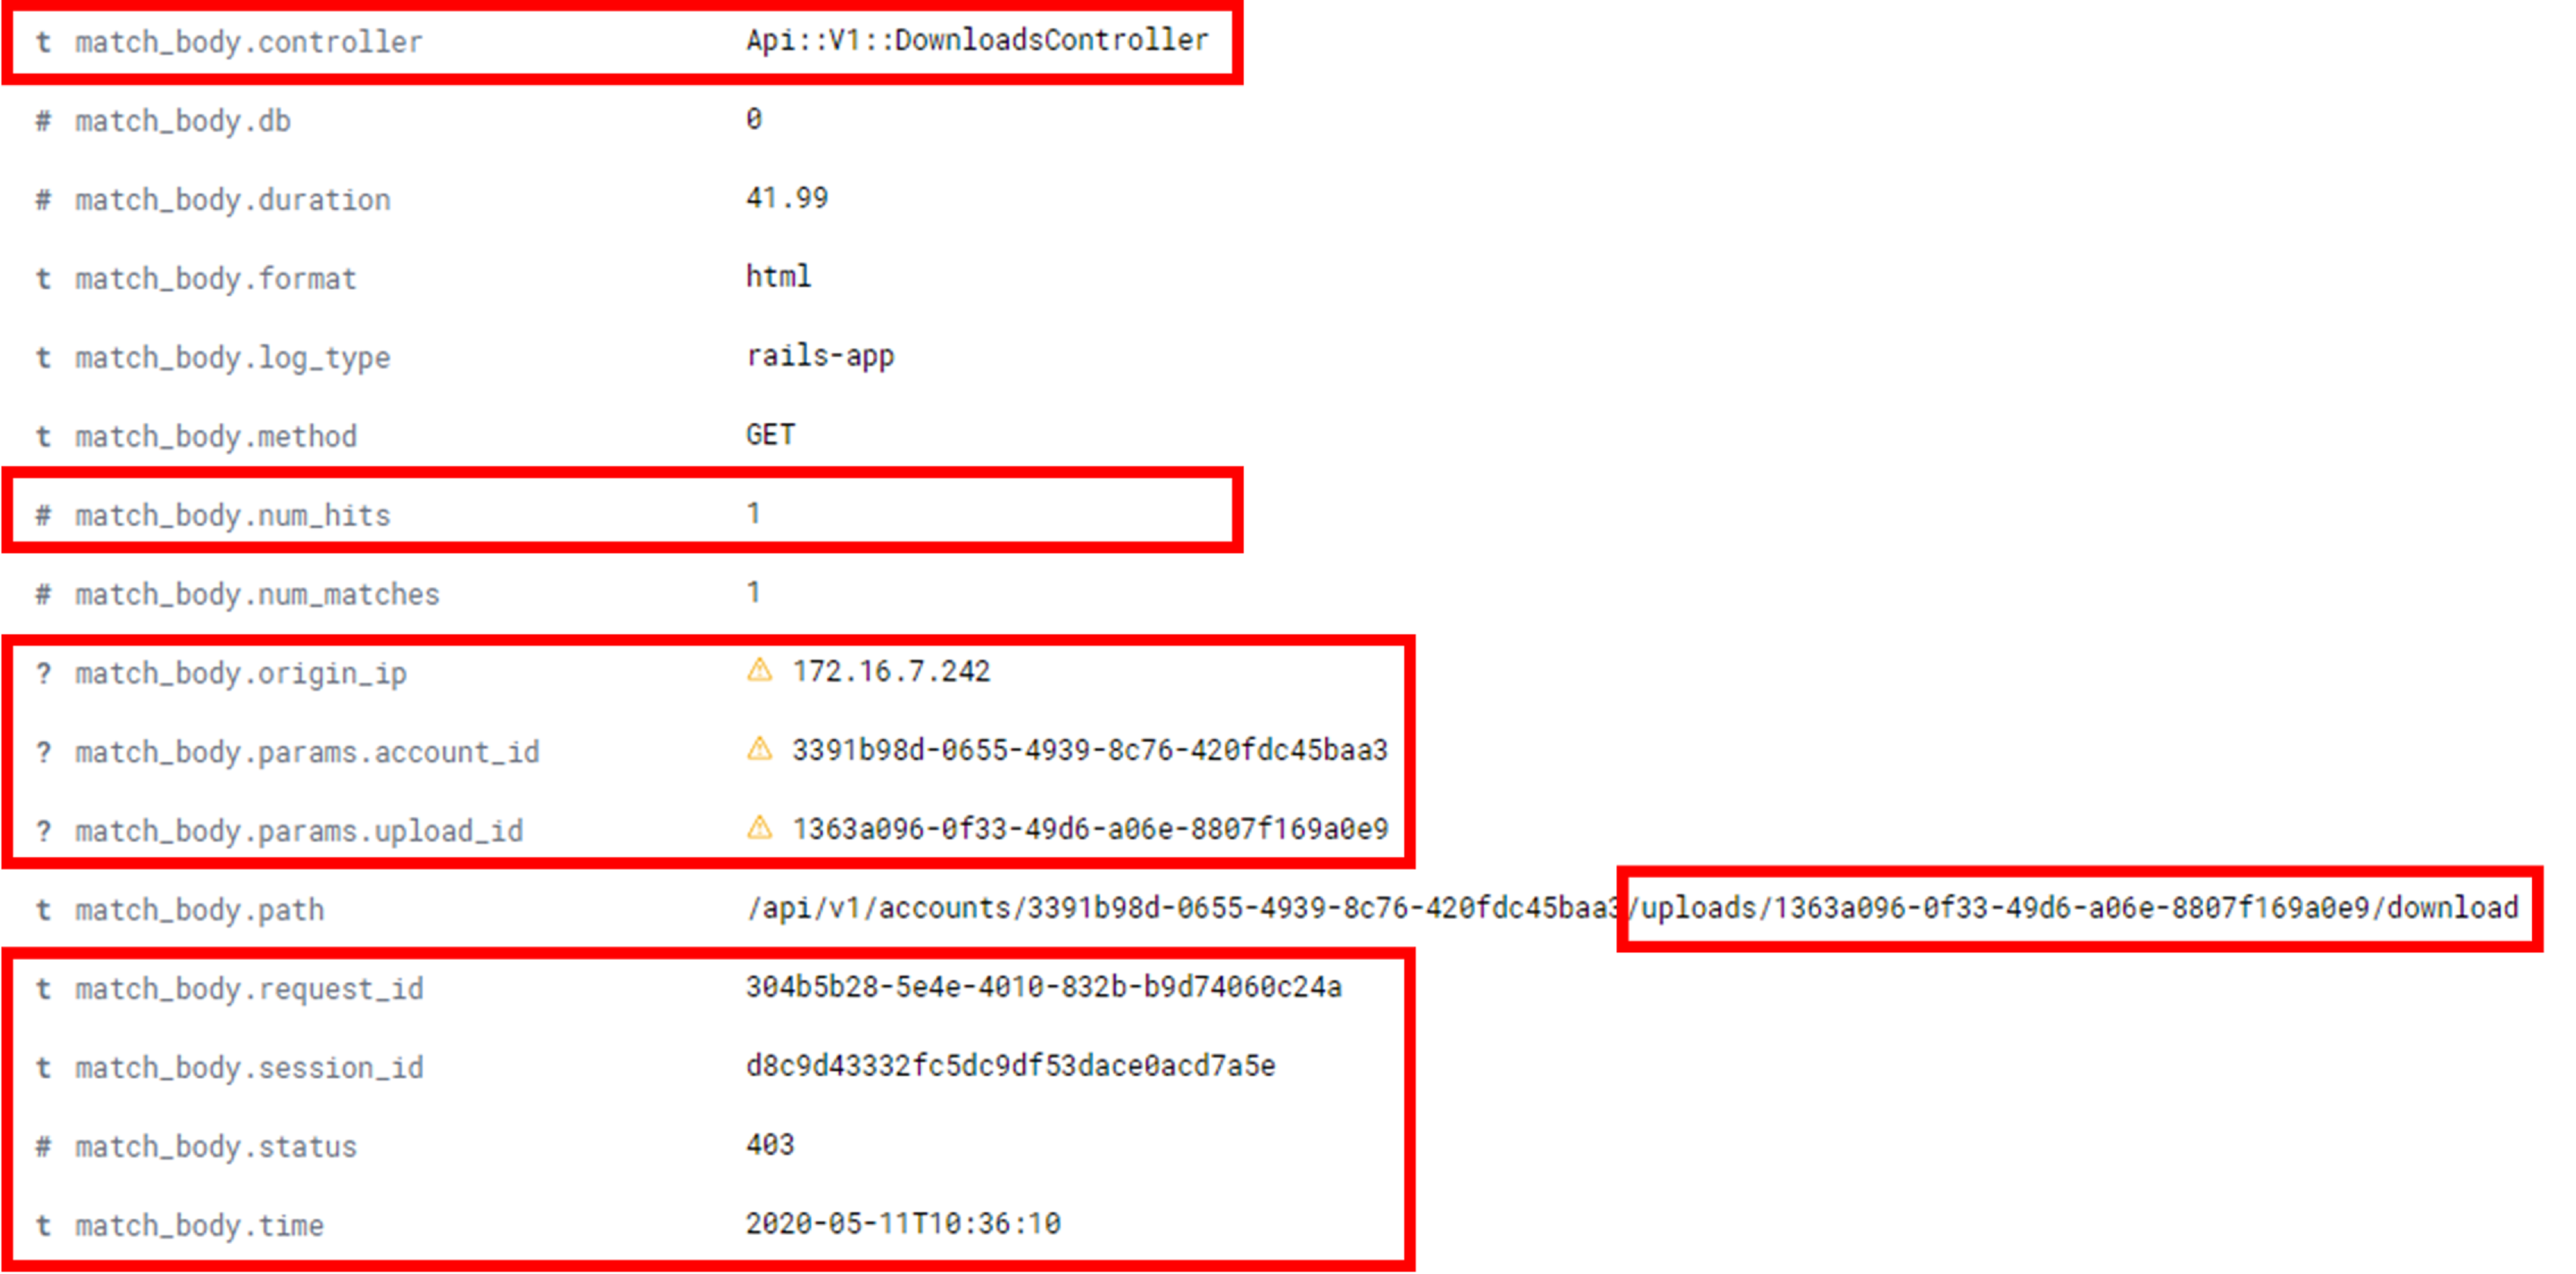
Here we can see the following mapping on our logging > alerting > responding journey:
- Logging: Detailed request body, targeted resource, timestamp, request and session IDs, API metadata and other key indicators were logged.
- Alerting: A simple search for 403s from the DownloadsController API was performed by Elasticsearch/ElastAlert. The query that was used was: status:403 and controller:"Api::V1::DownloadsController". This was defined in an ElastAlert YAML rule file, as shown below. That ElastAlert rule hit then sent a notification to Kibana and could be configured to email relevant team members.
name: Access control violation downloading a file
type: any
index: rails-app*
realert:
    minutes: 5
timeframe:
    hours: 1
filter:
- query:
    query_string:
        query: 'status:403 AND controller:"Api::V1::DownloadsController"'
alert:
    - "debug"
match_enhancements:
- "elastalert_modules.app_enhancements.SessionDataEnhancement"- Responding: That same ElastAlert notification could be sent to a webhook endpoint on our app, which could be used to trigger a response without native awareness. That response could be to kill a user's session or present a CAPTCHA. Manual action in response to an email notification could also take place.
- Alerting on file downloads in excess of a set threshold per-user.
- Alerting on file downloads in excess of a set threshold across the entire app.
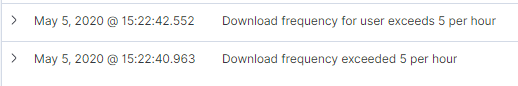
Here we can see the following mapping on our logging > alerting > responding journey:
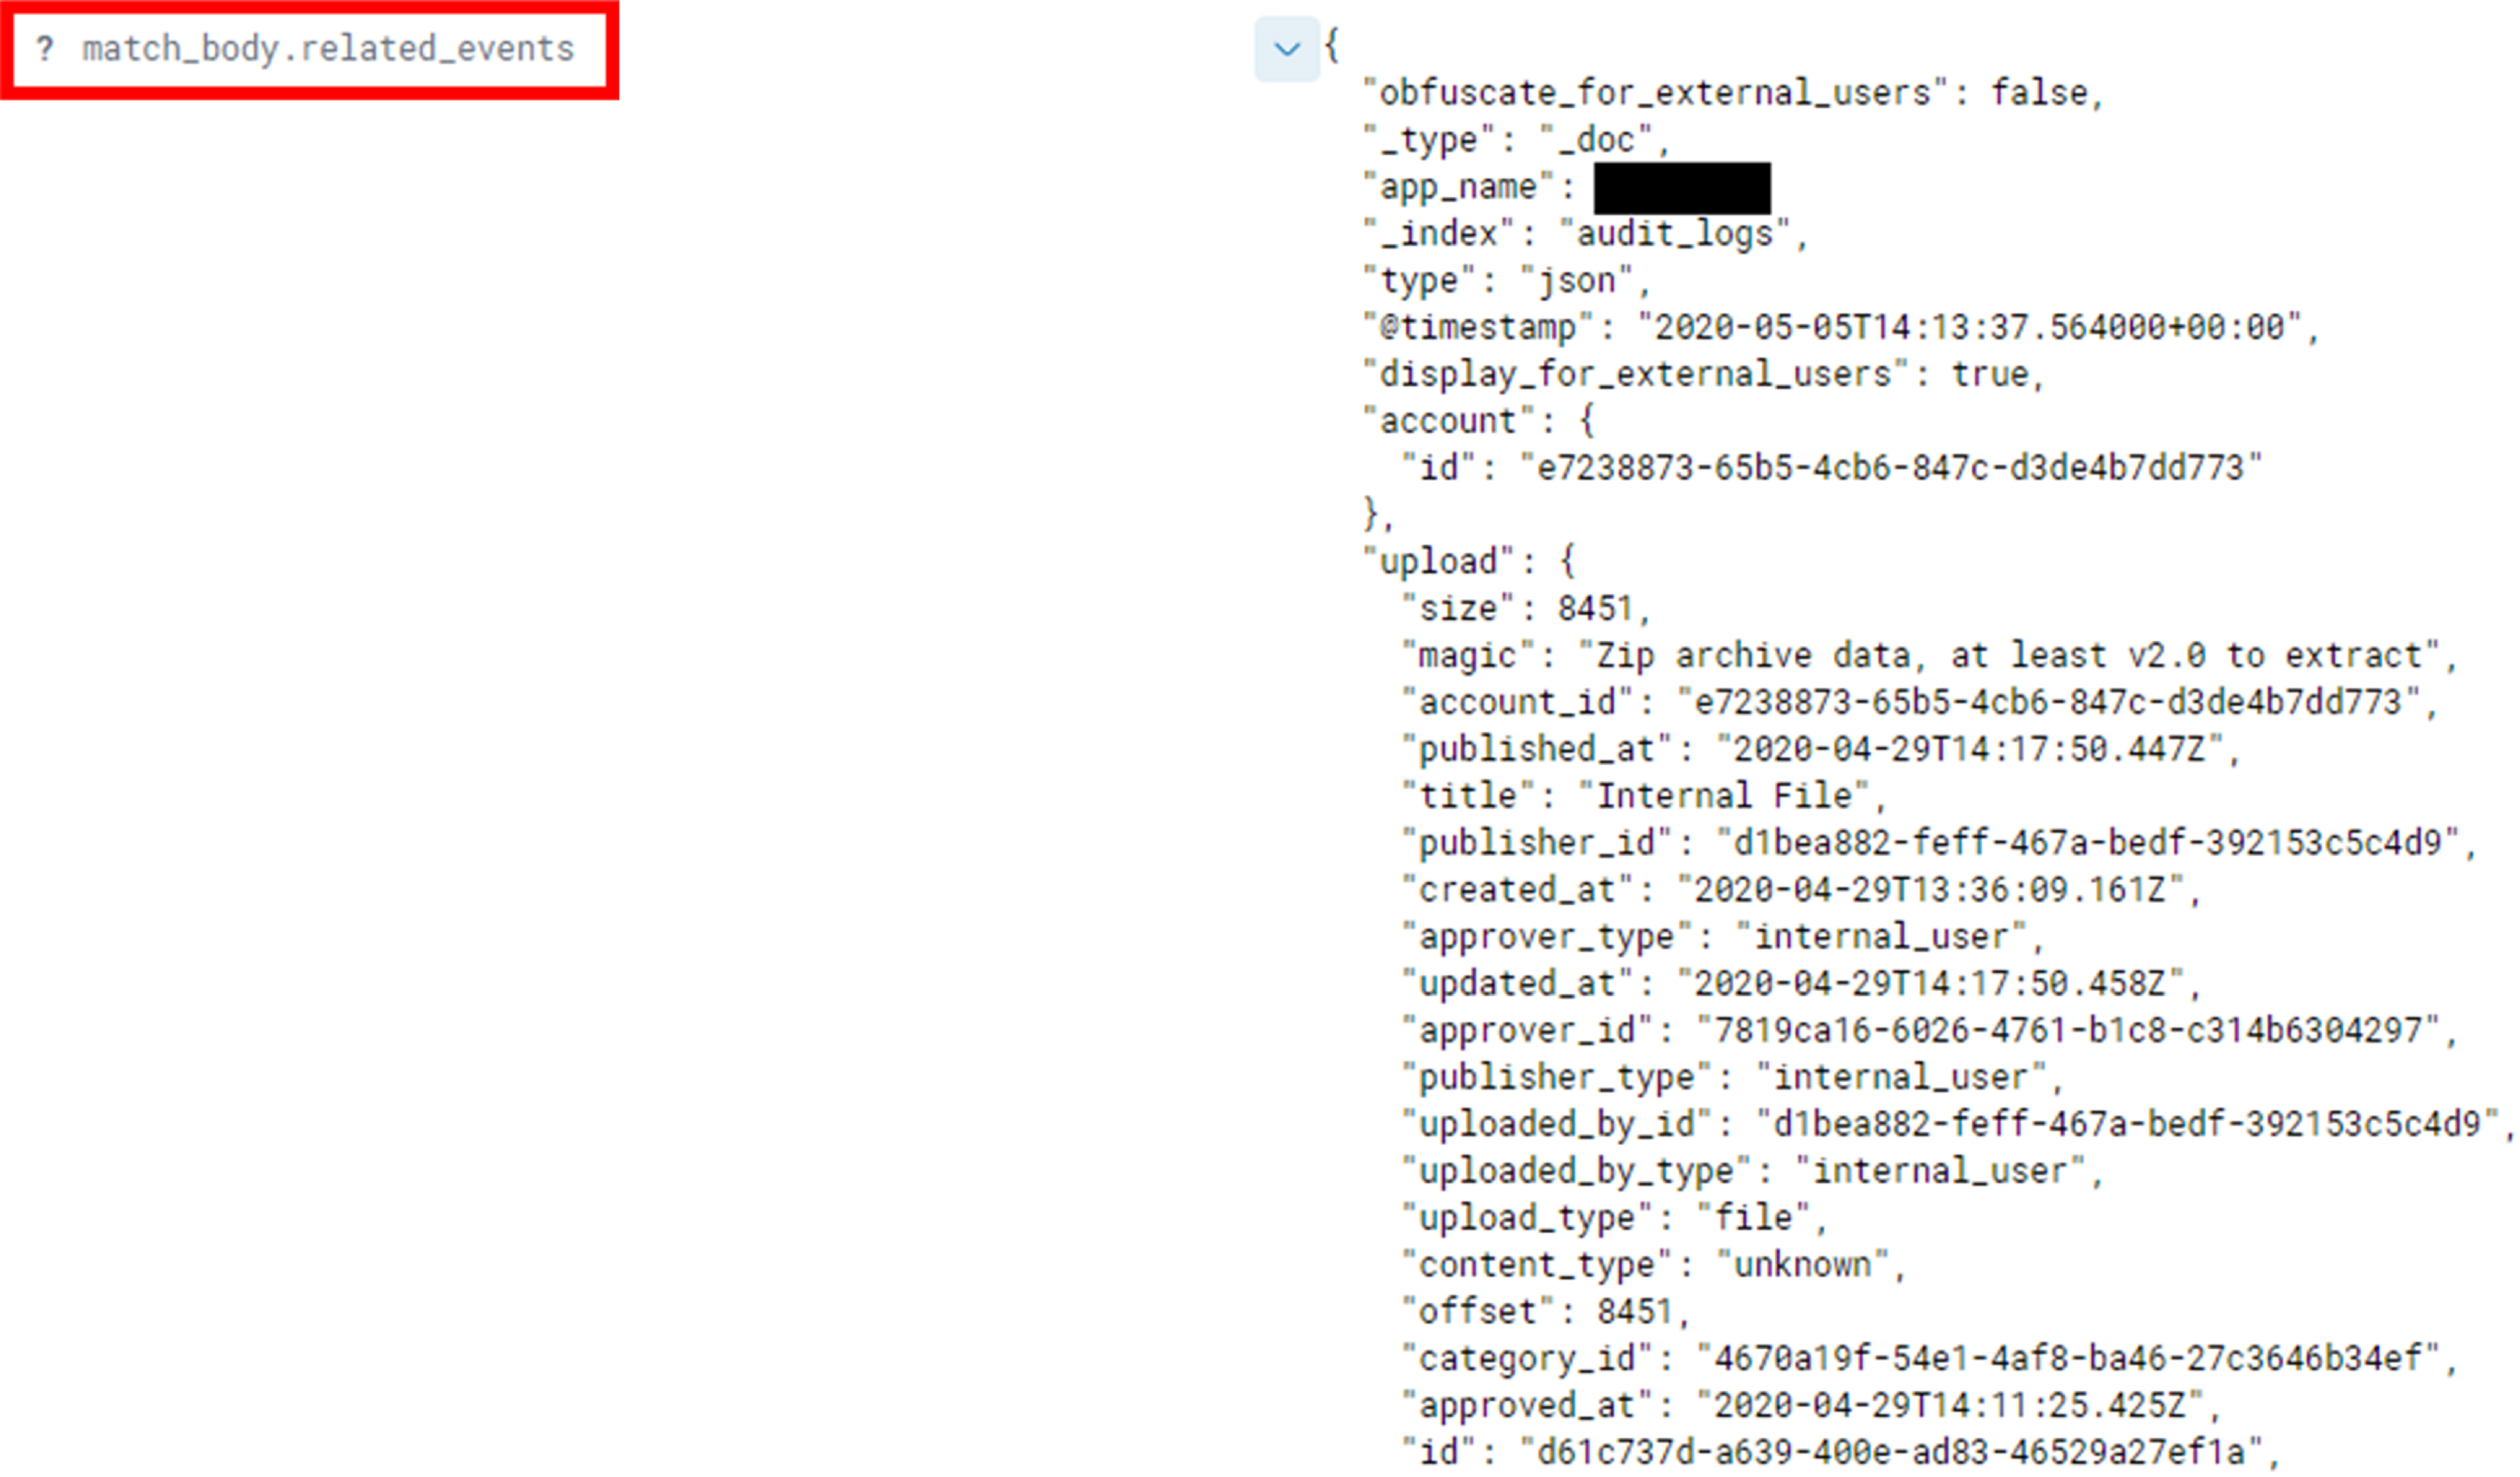
- Logging: Detailed request body, file name and metadata, user type, timestamp, request and session IDs, uploading user, accessing user, API metadata and other key indicators were logged.
- Alerting: All download events were sorted according to the user.id field in Elasticsearch, with these compared to a set threshold (5) per-hour by ElastAlert. This was defined in an ElastAlert YAML rule file, as shown below. That ElastAlert rule hit then sent a notification to Kibana and could be configured to email relevant team members. The threshold values should be modified going forward, as the app threshold being much higher than the per-user one.
name: Download frequency for user exceeds 5 per hour
type: frequency
index: audit_logs*
realert:
    minutes: 0
num_events: 5
attach_related: true
query_key: user.id
timeframe:
    hours: 1
filter:
- term:
    message: "successfully downloaded an upload"
alert:
- "debug"- Responding: That same ElastAlert notification could be sent to a webhook endpoint on the app, which could be used to trigger a response without native awareness. That response could be to kill a user's session, present a CAPTCHA or serve up a file containing a honeytoken to track the malicious users. Manual action in response to an email notification could also take place.
- Alerting on specific 403 and 404 responses as an authenticated client ID enumeration attempt.
- Alerting on specific 404 responses as an indicator of directory traversal.
Many of these alerts were very coarse-grained, with a lack of insight into specific access control violation causes. Additionally, the defined thresholds were too low, resulting in a number of false positives. However, the foundations for that alerting were now in place. Incremental recommendations were therefore made to increase the value and accuracy of these alerts.
The strong foundations established by the use of Elasticsearch, Kibana and ElastAlert meant that it was now trivial to introduce new alerts. Indeed, while we were working with the dev team during iteration #2, numerous new alerts (such as access control and account lockout ones) were able to be introduced. Long-term, these alerts should be defined and maintained by the detection and response team, who have greater insight into attacker actions. At this stage, our focus was introducing exemplar, high-fidelity alerts and identifying very application-specific indicators.
As with our metric capturing and visualisation, the alerting performed here was done offline, but could be used to enable responsiveness using the ElastAlert tool and webhooks, as described above.
Throughout this process, the importance of the dev team was evident - understanding what they were resolving and what useful log data to alert on looked like, rather than simply following prescribed steps in a report issued to them. For example, a list of resultant 403 and 404 responses may have been identified by the security team, but those may have changed by the time the dev team implemented the change. When the dev team understood what to log and alert on, they were far more effective at quickly and accurately implementing alerts - putting security in the minds of developers throughout the process is always a key goal. This will also make it easier for detection and response teams to understand application context and define their own alerts when they become involved at later stages.
Injection
Our recommendations for the devs to implement here had included a few different short-, medium- and long-term approaches:
- Features such as the "report-uri"/"report-to" endpoint within Content Security Policy could provide some indicators of non-compliant payloads such as XSS or remote file inclusion.
- Code changes could be introduced to identify high-fidelity indicators (e.g. the word "script" or single quotes ( ' ) in logs).
However, it became apparent that these actions wouldn't be a long-term or hugely beneficial use of time. Any hard-coded, high-fidelity detections would effectively be a denylist - our own WAF, in a sense. So integrating a commonplace WAF and using the logs it generated seemed the most pragmatic solution - though one that would be a reasonable integration undertaking in itself. So for now, it was decided not to introduce any logging or alerting improvements for this category, instead deciding to defer that to a future iteration.
The results
Our initial threat modelling exercise helped us understand the application and generate appropriate test cases. This would also allow us to demonstrate where we were focusing and where we had improved, and evidence the value of the exercise to senior stakeholders. In iteration #1, we baselined the application's current detection and response capability across those test cases, noting particular weaknesses in its logging and making suggestions for what alerting to begin including. In iteration #2, we reviewed the efficacy of those logging changes and made incremental suggestions for new alerting to include.
The main changes introduced so far in our case study can be summarised as:
- All baseline metrics were now at least partially captured (i.e. visible, but not sufficiently detailed), with the vast majority fully captured. This meant that timestamps, source IP addresses and other metadata were now tracked.
- The amount of data logged had significantly increased, with all of the above test cases now at least partially generating logs. Within that, roughly half of the test cases which were only partially logged after iteration #1 were now fully logged.
- Those logs were aggregated to Elasticsearch, with additional indicators such as timestamps and correlation IDs included in all logs. This allowed quick, powerful queries to be performed on that log data.
- Exemplar, high-fidelity alerting had been introduced, driven first by the introduction of Kibana dashboards to aid with visualisation. While only a small number of alerts were currently implemented, the foundations to introduce more and do so easily were there. This is where we should begin handing this responsibility over to the blue team.
- That alerting had only been introduced for the "Enumeration" test cases.
- While no existing work had yet been performed on these areas, the security and development teams had identified a plan for how to:
- Better log and alert "Injection" test cases.
- Introduce responsiveness into the application without replicating effort.
The below tables show the metrics we now captured, alongside the improved logging and marginally improved alerting across our 2 test case categories:
As we described in the article on the 'Our Thinking' section of the F-Secure website, our motivation for this research was as a response to engagements where we were able to achieve end-to-end compromise of a client’s estate, using a web application as the entry point, while remaining undetected. While this example application would not yet be in a state to detect or respond to those attacks, the above demonstrates that the organisation is now closer on that journey. Specifically, attacks enumerating user profiles or files, in an attempt to elevate privileges or access sensitive data, could now broadly be detected. Detection of attacks relevant to an end-to-end compromise would be more reliant on "Injection" detection, and improvement in that area should be evidenced after iteration #3.
Immediate next steps
The above allows us to easily identify some residual gaps; the next 3 likely focuses for this application will probably be:
- Incremental changes and additions to the current logging and alerting.
- Introducing alerting for the "Injection" category, using a similar approach to the one used for "Enumeration".
- Beginning to introduce responsiveness for the "Enumeration" test cases which have already moved through logging > alerting.
To accomplish the second and third focus, we plan to reuse existing components again. Specifically, integrating the ModSecurity WAF with the OWASP core ruleset should serve as a starting point for many common web security attack types, particularly helping to address the "Injection" gap. This approach was previously considered by AppSensor, but our goal here is to send the WAF logs as simply another log source to our ELK stack, rather than to a bespoke component like AppSensor; we can then hunt through those logs and define appropriate alerts similar to the above.
Note that we're only interested in using the WAF for telemetry - to generate logs - not to try and prevent exploitation; as discussed in our separate "Why?" post, prevention is not our focus here. What that log data looks like and how easy it is to get it in the necessary format and sent to Elasticsearch remains to be seen, but it is considered an easier solution than "rolling our own" with hard-coded injection detection, and would provide broad coverage.
A variant of WAFs is RASPs (Runtime Application Self-Protection tools). RASPs integrate into the application via a binary that can be executed on the web server, and have many benefits, including automatic IP-based response, increased telemetry, and support for common detection and response toolsets. However, RASPs alone are not sufficient to make an app attack-aware, due to:
- Responding primarily at the IP-level and not the user-level. This makes attribution of actions or application-level response challenging. Response instead comprises blocking IP addresses.
- Focusing on known malicious data (i.e. rule hits) and not on healthy application metrics. This would make it challenging for detection teams to hunt through related events. RASP tools usually focus on vulnerabilities, and not abuses of legitimate business logic or more nuanced indicators.
- Complex decisions regarding how often telemetry and alerts are shared with Elasticsearch, Splunk, etc. Sometimes this may be streamed in real-time, whereas other times it may be aggregated or sent to a 3rd party system for analysis. This can slow down potential attribution or response.
However, if your organisation is already using a commodity RASP, it is likely beneficial to integrate this into your app-level detection and response solution, rather than an open source WAF which may require more tuning.
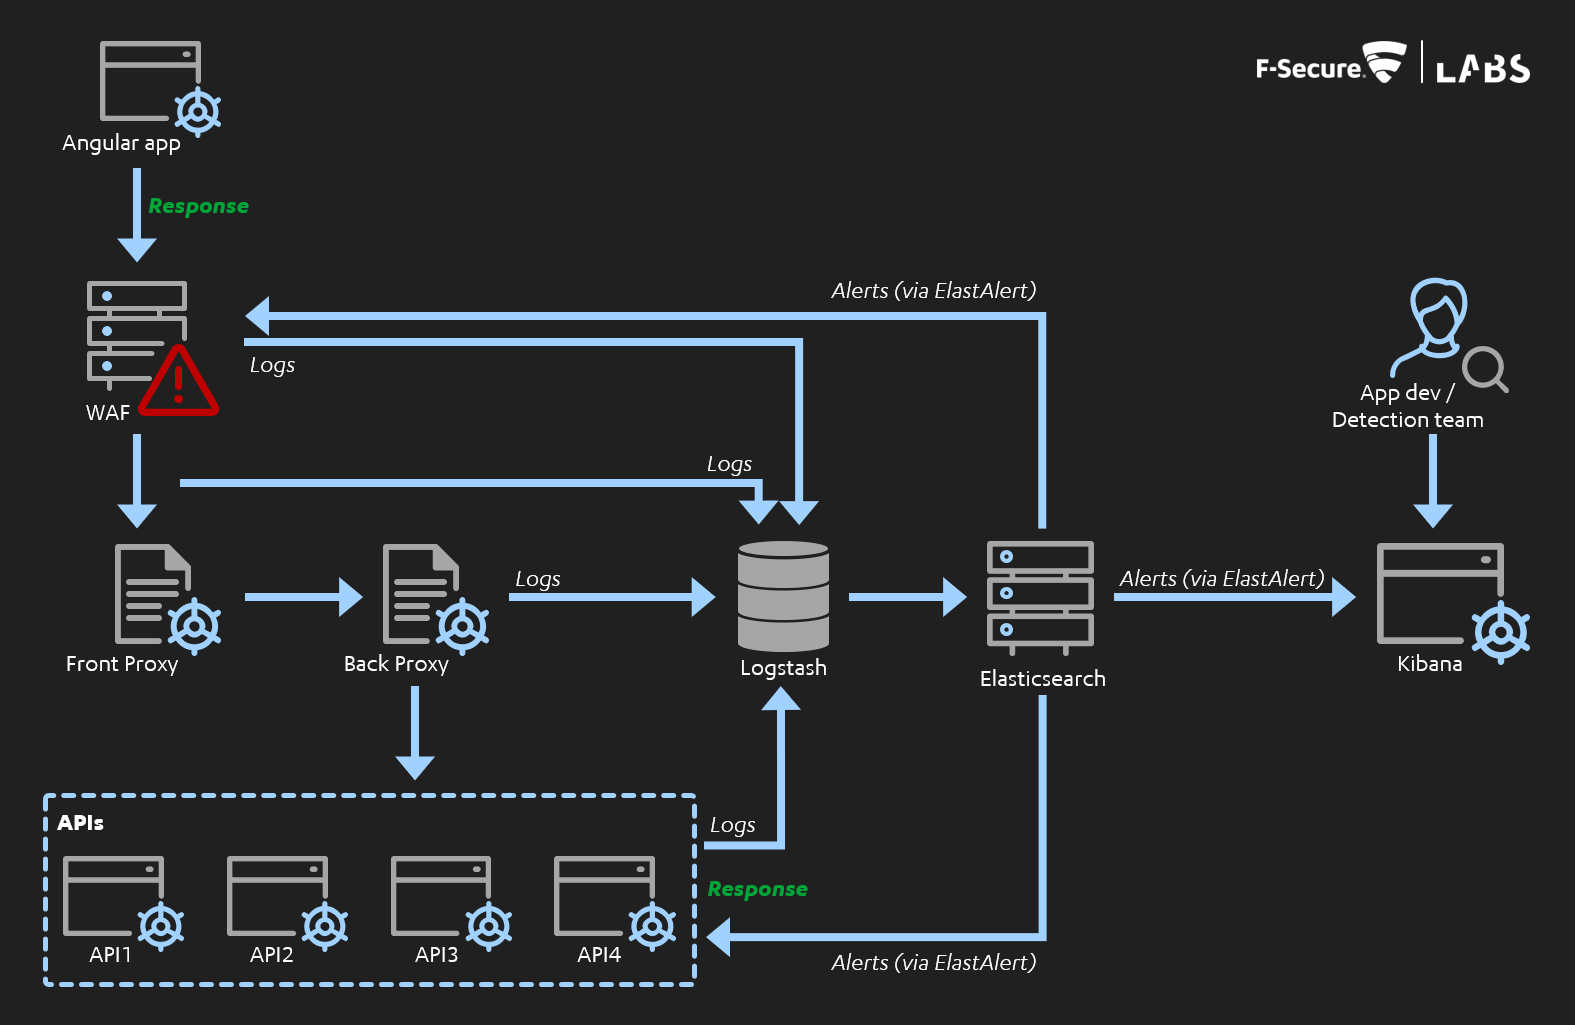
For responsiveness, our intention is to avoid significant code changes if at all possible, and to avoid duplication of effort. Ae've created a source of all of our log data and the logic to generate key alerts, - in an offline manner - we don't want to redo all of that at the code-level. The dev team believe the ElastAlert tool currently used to send notification of the rules being triggered to Kibana can help us do this. This could involve creating a webhook-style endpoint on the app which ElastAlert posts alerts to, or directly exposing app endpoints such as "lock account", "introduce CAPTCHA" or "kill session" to ElastAlert (though the latter obviously introduces other architectural risks).
Broadly, the design we're aiming for - its aggregation of logs, its flow along logging > alerting > responding and its reuse of existing components - is shown in the diagram below:
Future work
The above are our next steps for this case study. There also exists multiple areas to expand and improve upon for app-level purple teaming as a whole. Our current and planned focuses include:
- More thorough alignment with common frameworks, such as MITRE's ATT&CK or OWASP's AppSensor Detection Points or Top 10. This will help provide more executive-level visibility of our progress and a pragmatic view of a given app/organisation's strengths and weaknesses. This will also ensure our efforts cover a standardised methodology as a baseline.
- Alignment with existing detection and response practices, such as using industry-standard SIEM signature formats like Sigma.
- Focus on equivalent detection and response in cloud-hosted and even cloud-native applications. For these apps, the toolsets we'd need to use would almost certainly be ones specific to the cloud provider (e.g. CloudWatch in AWS). Several of the areas (such as deploying a WAF or generating application load metrics) could be enabled almost at the click of a button. However, from experience, we've found that the logs generated by those cloud-native WAFs are very variable in their completeness and usefulness.
- The use of honeytokens, honeytables and other such techniques – i.e. high-fidelity files and data, which are not intended to be accessed legitimately – could be included through short detection and response sprints. When built upon existing detection and response foundations, this could greatly aid with high-fidelity detection of specific attack types. This also allows us to realise parts of the "annoyance, attribution and attack" trifecta from John Strand's excellent "Offensive Countermeasures: The Art of Active Defense" book.
- Exploration of existing techniques used for anti-fraud efforts, including those used for fingerprinting users and manual response, and how these could cooperate with the tools discussed here.
- Most crucially, thorough consideration of who is watching these logs and alerts – in our case study, this had been collaborative with the dev team. Long-term, it should be an organisation's de facto detection and response team. Key considerations for threat hunters working through this extra log source might include:
- This is not endpoint-based detection, so we're looking at a pre-compromise stage. How much we weight that data, compared to other post-compromise indicators later in the kill-chain, would need to be decided.
- This may include app-level indicators (e.g. XSS payloads) or ones that touch infrastructure (e.g. a web server user running "whoami" commands or high quantities of new files in the "uploads" directory). These would appear in different log sources.
- The data received would need to be normalised and easy for hunters to query.
- The context of the app is important, but so too is the context of the attack itself (i.e. what activity happened around it).
- Effective app-level threat hunting might include a blend of high-fidelity alerts for high-risk actions and some monitoring for a combination of lower-risk actions. This would require visibility of both the alerts and the raw log data.
- How frequently we send log data (i.e. real-time, aggregated or on-demand) will vary.
Conclusion
This is a specific case study of our use of application-level purple teaming for one organisation. Organisations seeking to adopt this approach as part of their AppSec and detection and response efforts should consider the relative strengths of their existing app-level logging, alerting and response and consider where that starting point should be. Wherever that starting point is, alignment to the 6 high-level principles introduced at the start of this article will help to focus efforts and demonstrate value. For more on that demonstration of value and the history of this area, please refer to the article on the 'Our Thinking' section of the F-Secure website.
Resources
Verizon DBIR: https://enterprise.verizon.com/en-gb/resources/reports/dbir/
F-Secure - Building cyber resilience by changing your approach to testing: https://www.f-secure.com/en/consulting/our-thinking/cyber-security-readiness
OWASP AppSensor documentation: http://www.appsensor.org/overview.html
OWASP AppSensor detection points: https://wiki.owasp.org/index.php/OWASP_AppSensor_Project#tab=Detection_Points
MITRE ATT&CK framework: https://attack.mitre.org/techniques/enterprise/
ElastAlert docs: https://elastalert.readthedocs.io/en/latest/elastalert.html#overview
ElastAlert GitHub: https://github.com/Yelp/elastalert
ModSecurity: https://www.modsecurity.org/about.html
OWASP ModSecurity Core Rule Set (CRS): https://owasp.org/www-project-modsecurity-core-rule-set/