Sysdiag -who?
By Harry Senior on 1 December, 2020
Introduction
Sysdiagnose is a utility on most macOS and iOS devices that can be used to gather system-wide diagnostic information. Currently on version 3.0, sysdiagnose collects a large amount of data from a wide array of locations on the system.
This blog post will seek to outline the immediate value of the data collected by sysdiagnose for the purpose of an investigation. There have been multiple guides and breakdowns of sysdiganose in the past, however, I hadn't identified any that sought to address the shortcomings of the data collected in identifying compromise. As a result, this post will look to wrap sysdiagnose in a collection script to rectify some of these. It will then provide some example detection cases that show the collected data using a revised collection script to investigate malicious activity.
Usage
Sysdiagnose can be useful in host investigations, either to conduct live forensics or where a full disk acquisition is a required part of the investigation.
The process of forensic imaging on macOS devices is comparatively challenging compared to other operating systems, and relies on specialized commercial software. Therefore, live forensics can often be a more suitable option for conducting investigations on these devices.
The output of the sysdiagnose command provides preliminary triage data that can identify areas for further investigation once full disk acquisition has finished. The data collected includes:
- A spindump of the system
- Several seconds of fs_usage ouput
- Several seconds of top output
- Data about kernel zones
- Status of loaded kernel extensions
- Resident memory usage of user processes
- Recent system logs
- A System Profiler report
- Recent crash reports
- Disk usage information
- I/O Kit registry information
- Network status
- If a specific process is supplied as an argument: list of malloc-allocated buffers in the process's heap is collected.
- If a specific process is supplied as an argument: data about unreferenced malloc buffers in the process's memory is collected.
- If a specific process is supplied as an argument: data about the virtual memory regions allocated in the process.
Reference: Information on data collected by sysdiagnose from the man page.
Data collected by sysdiagnose can be valuable in a variety of investigations. For investigations involving malware, the data captured can help identify the malicious binary, a persistence mechanism, or any C2 connections. For investigations where data exfiltration is a concern, there is network data that can identify any open connections, or any USB devices mounted to the file system using Apple's unified log archives.
Analysis
In this section we will review several data sources collected by sysdiagnose. With brevity in mind, this post will not cover all artefacts in detail, but will seek to highlight those valuable for forensic investigations. These artefacts can mostly be analysed using tools on non-macOS operating systems, with the only notable exception being Apple’s unified logs.
General
When executed sysdiagnose will display a warning message noting that the output will often contain personal and detailed device information; therefore, any data collected using this utility should be handled securely. By default, the resulting collection is a ‘tar.gz’ file saved to ’/var/tmp/sysdiagnose_[Timestamp]_[Hostname].tar.gz’. There are options to not compress the output and to also save the output to an alternate location. The screenshot below shows the command line output of running sysdiagnose as well as the directory opened after completion.
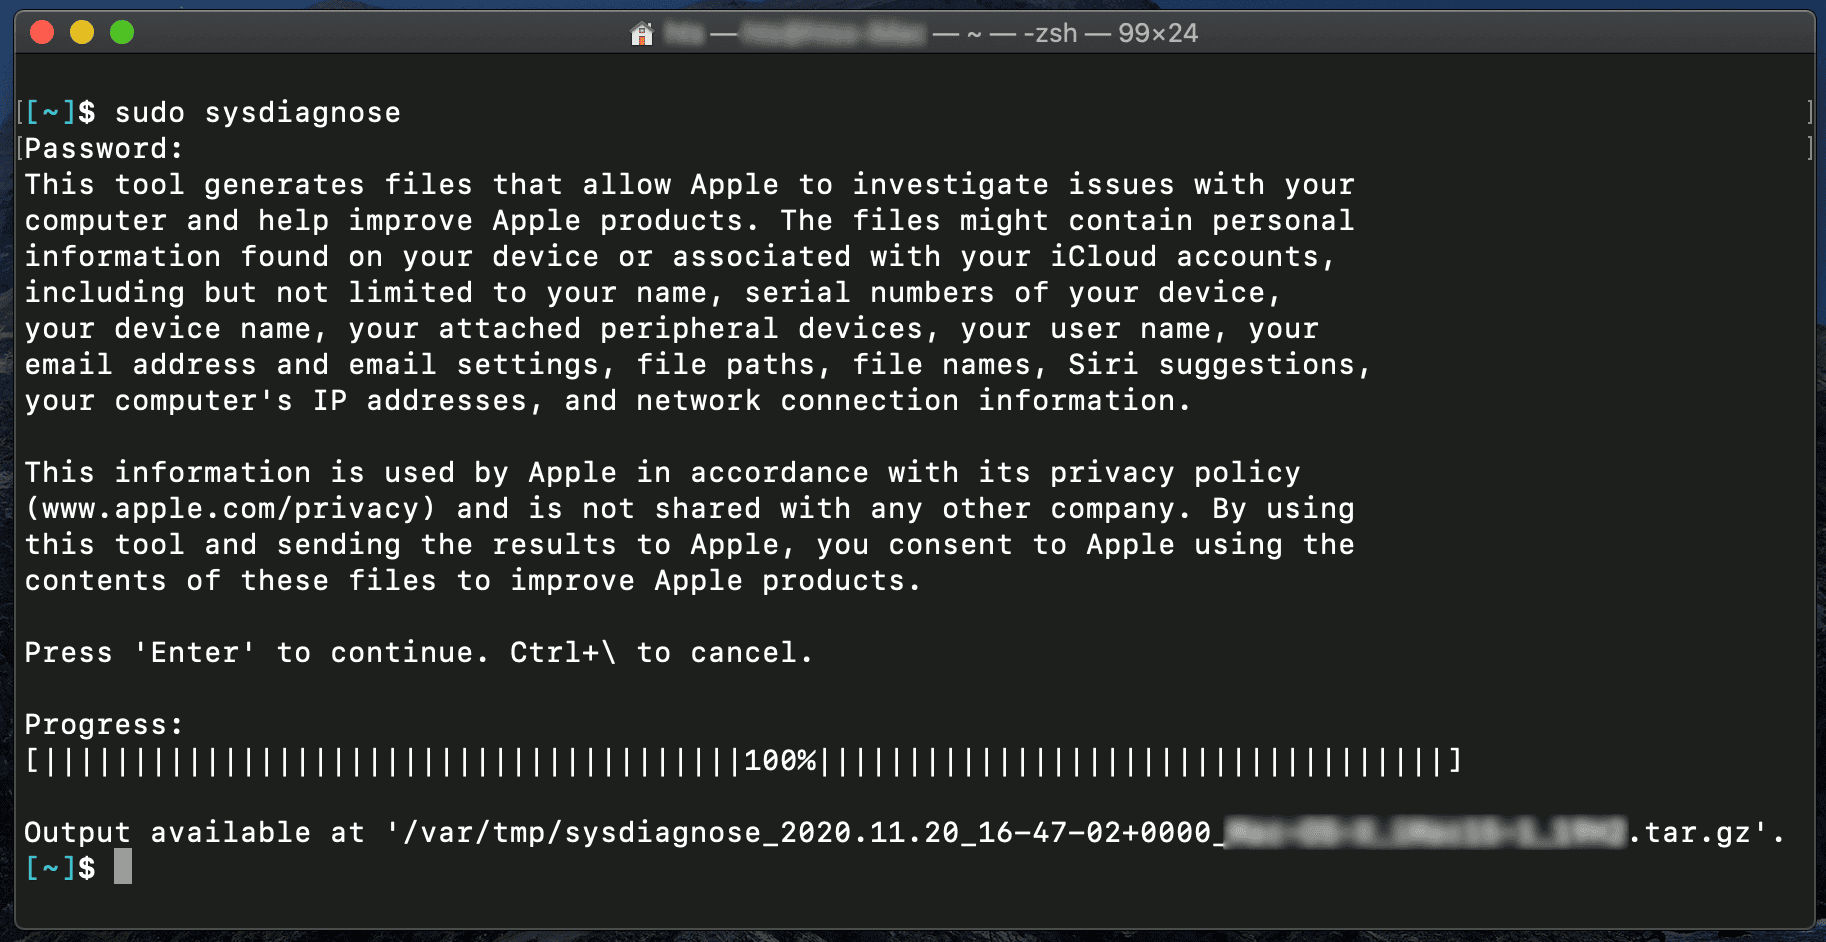
Reference: Screenshot showing sysdiagnose being run in Terminal and the output directory the collection was saved to.
A typical collection includes:
- Accessibility/
- BluetoothTraceFile.pklg
- DiskMountConditioner.json
- Personalization/
- Preferences/
- README.txt
- RunningBoard/
- SystemConfiguration/
- SystemProfiler/
- TimezoneDB/
- WiFi/
- WindowServer.external.winfo.plist
- acdiagnose-501.txt
- airport_info.txt
- apfs_stats.txt
- applessdstats.txt
- apsd-status.txt
- bc_stats.txt
- bless_info.txt
- bootstamps.txt
- brctl/
- ckksctl_status.txt
- com.apple.windowserver.plist
- crashes_and_spins
- csrutil-status.txt
- ctsctl-list-*.txt
- darwinup.txt
- disks.txt
- diskutil_*.txt
- display_diagnose.txt
- efi-dump-logs.txt
- error_log.txt
- errors/
- filecoordination.txt
- fileproviderctl*.log
- find-system-migration-history.txt
- footprint-all.txt
- fs_usage.txt
- gpt.txt
- hdiutil-pmap.txt
- hidutil.plist
- hpmDiagnose.txt
- [Hostname].mdsdiagnostic
- iogdiagnose.txt
- ioreg/
- kextstat.txt
- launchctl-dumpstate.txt
- launchctl-list-*.txt
- launchctl-print-*.txt
- libtrace/
- logs/
- lsappinfo.txt
- lsregister-*.csstoredump
- microstackshots
- mount.txt
- nclist.txt
- network-info/
- nfsstat.txt
- night-shift.log
- nvram.txt
- odutil.txt
- oslog_archive_error.log
- otctl_status.txt
- pcsstatus.txt
- pluginkit-501.txt
- pmset_everything.txt
- powermetrics.txt
- ps.txt
- ps_thread.txt
- remotectl_dumpstate.txt
- resolv.conf
- sample-*-highcpu.txt
- securebootvariables.txt
- security-sysdiagnose.txt
- sfltool.LSSharedFileList.*.txt
- smcDiagnose.txt
- spindump.txt
- summaries/
- sw_vers.txt
- swcutil_show.txt
- sysctl.txt
- sysdiagnose.log
- system_logs.logarchive/
- systemextensionsctl_list.txt
- tailspin-info.txt
- talagent-*.txt
- taskSummary.csv
- taskinfo.txt
- tbtDiagnose.txt
- thermal.txt
- top.txt
- var_run_resolv.conf/
- vm_stat.txt
Apple Unified Logs - ‘system_logs.logarchive’
One of the more verbose logs collected by sysdiagnose are the Apple unified logs, introduced in iOS 10 and macOS 10.12[1]. Making use of the OSLog framework[2] this system of logging collates several important log sources into one. There is vast potential value in these logs, but due to their complexity and size, a full exploration is out of scope for this blog post. A limitation with this log format is parsing them into a human readable format. The log command is exclusive to macOS and the files contained in the 'system_logs.logarchive' directory are in a proprietary format, referred to as a 'logarchive' bundle here.
Included below are a few methods for reading and analysing the logs that demonstrate their usefulness. The first method uses the log show command with the predicate flag and syntax[3]. This search returns USB/file system mounting events that can show when a user mounts a USB to the system. This might be useful in investigations where data exfiltration is a concern.[4]
log show –archive /path/to/sysdiagnose/output/system_logs.logarchive -predicate 'eventMessage contains[cd] "USBMSC" or processImagePath contains[cd] "fseventsd" or subsystem = "com.apple.imagecaIt is possible to use the same command to look for examples of any remote logins via SSH, a common piece of evidence to check for attacker activity.
log show –archive /path/to/sysdiagnose/output/system_logs.logarchive -predicate 'processImagePath contains[cd] "sshd"'The Console application on macOS is another method for searching the logs and has a simple and easy to use search syntax, an example is shown later in this post.
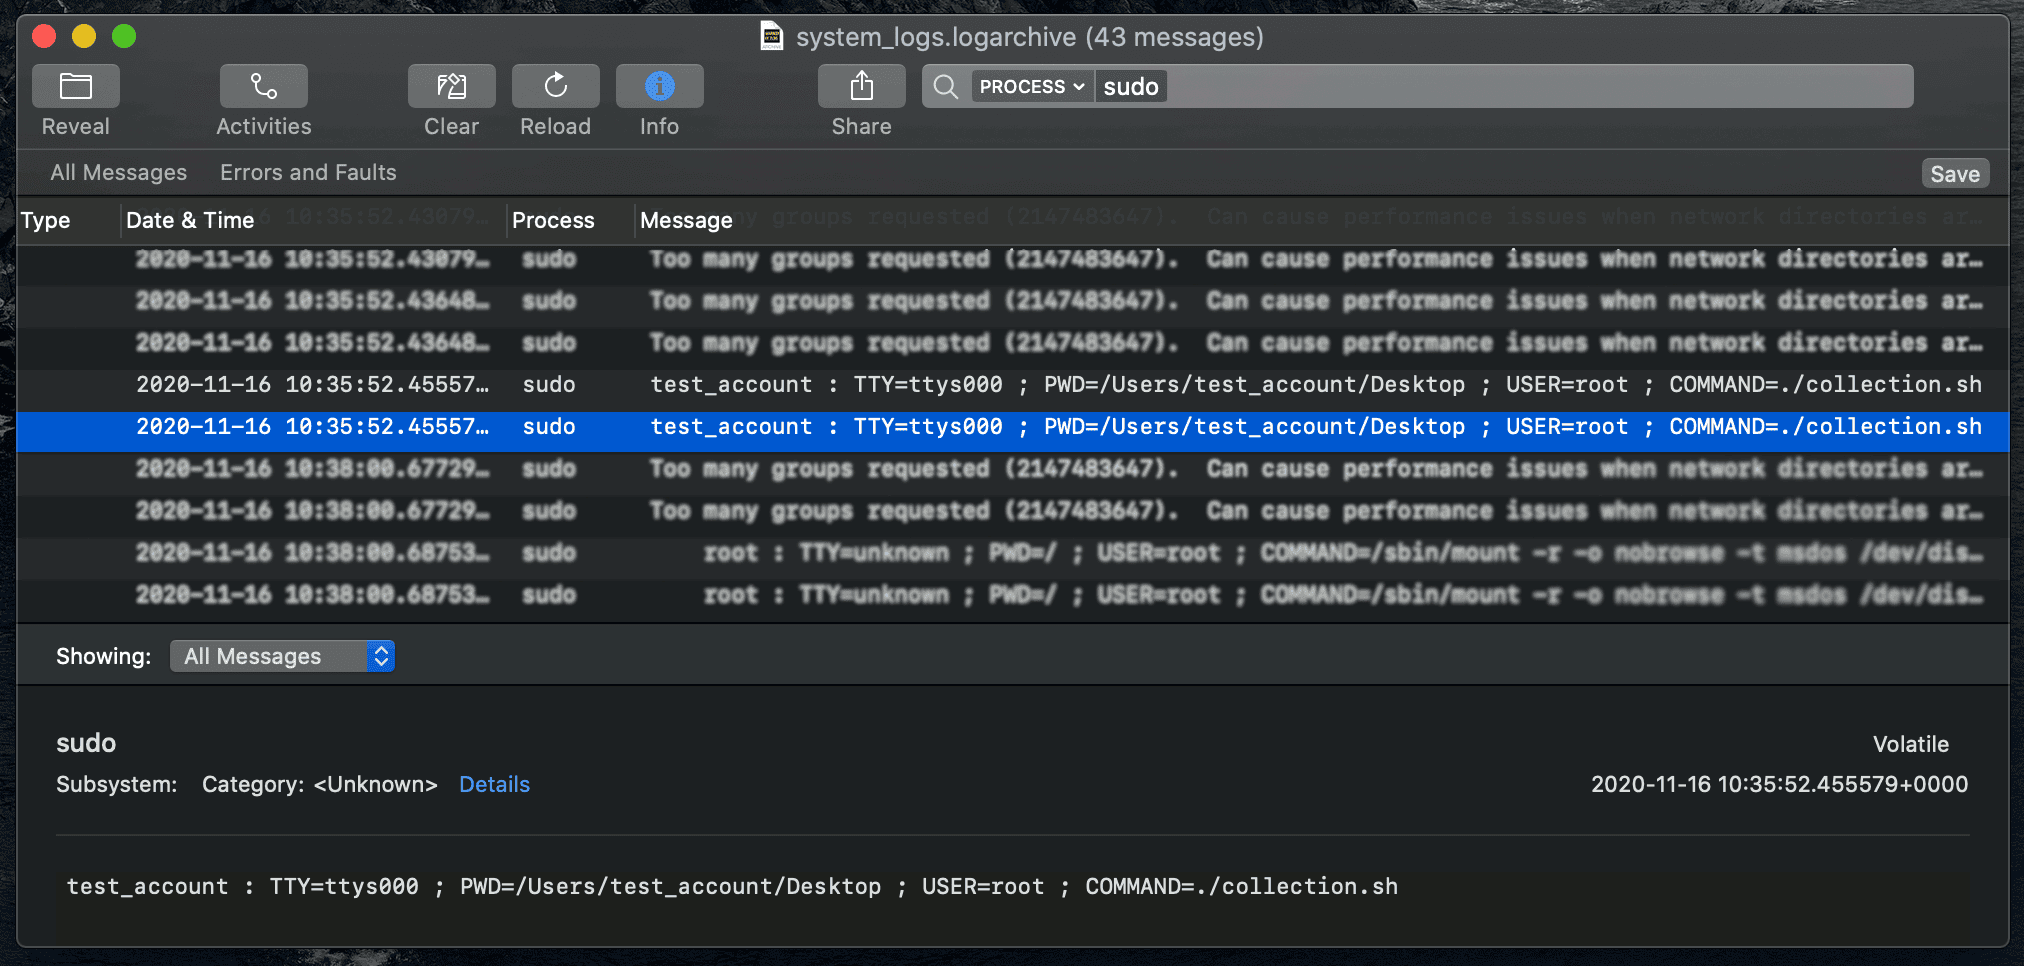
Reference: Screenshot of console showing a record of sudo being used to run collection.sh.
There is a python script on Github by ydkhatri that will read a ‘logarchive’[5]. The script reads the files that make up the ‘logarchive’ and provides several options for output format including TSV and an SQLite database. As the project status says this is a work in progress. Apple may well release a change to the format rendering a component unreadable on other operating systems.
It should be noted that the log command can also be used to create a file containing each log line as JSON using the style flag, though due to the number of logs contained in a ‘logarchive’ it is not recommended to dump the contents to file unfiltered.
Account Information - ‘acdiagnose-[UID].txt’
The acdiagnose text files contain details of the various accounts associated with the user’s local and iCloud accounts. Details include UUIDs, account configuration, syncing status and a breakdown on the types of accounts plus the ‘supportingDataClasses’ they can access. The information contained within this file can be used to answer a number of investigative questions, such as:
- What are the associated emails / usernames of the accounts?
- What are the associated phone numbers?
- Whether MFA is enabled on certain accounts.
- What accounts have access to what data and to what (‘*DataClass’ fields).
System Integrity Protocol (SIP) - ‘csrutil‘
SIP was introduced in 10.11, El Capitan to prevent users with root access manipulating system files. SIP can only be disabled from recovery mode, a safe boot feature allowing a user to configure the disk, reinstall the OS, or restore from backup.
This is a relatively simple file, though a valuable one, which shows whether the SIP is enabled or disabled. The data stored in the 'csrutil.txt' file should always indicate SIP is enabled. Opening the terminal window in recovery mode and running csrutil disable turns of SIP allowing changes to System files. SIP can then also be renabled in recovery mode by running csrutil enable.
Launch Daemons/Agents - ‘launchctl-*.txt’
launchctl is the service that loads and unloads launch agents and daemons, which are applications and services that are executed at launch and or logon. This can be useful for identifying possible persistence mechanisms. The data in 'launchctl-dumpstate.txt' contains environmental variables and paths to applications and executables. The other files contain individual user launchctl configurations.
Logs Directory
There are a couple of potentially valuable logs contained within this directory, for example:
- Install.log is a valuable source for determining what has been installed on the system. This appears to be limited to applications installed from the App Store. However, this can have some value as historically there have been cases of malware being packaged alongside legitimate applications on the App Store.
- DiagnosticMessages/[YYYY-MM-DD].asl, these Apple System Logs contain useful data that shows application usage. You can observe events like applications being launched from the dock or the loginwindow process locking the screen. These logs potentially have value in determining what is normal user behaviour. The limitation here is only logs for the date of collection are gathered, similar analysis is possible using the ‘logarchive’ data.
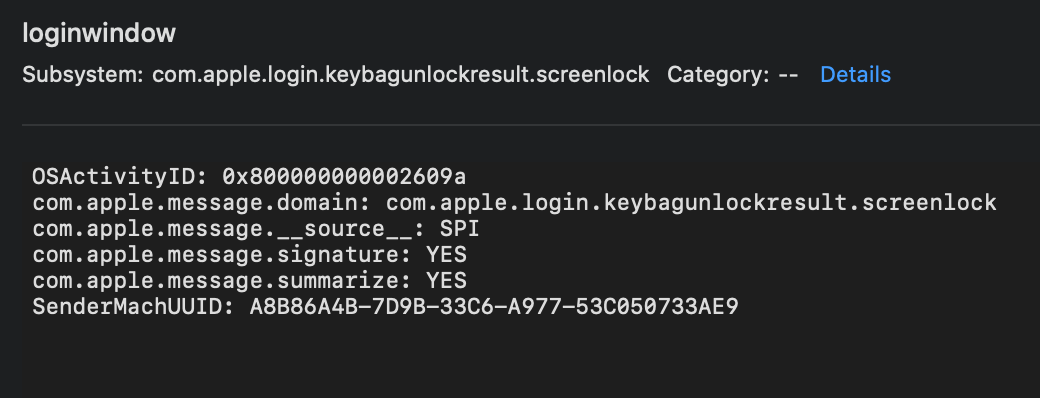
Reference: loginwindow process log as seen in Console.App shown launching Spotify
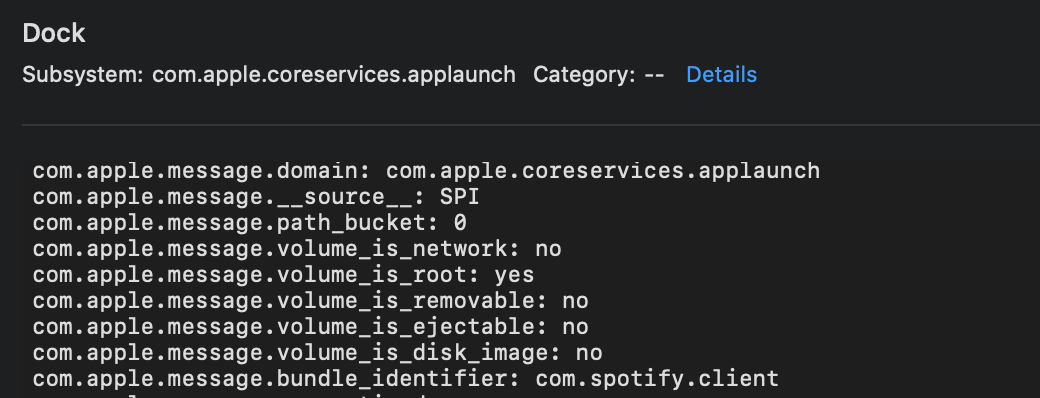
Reference: dock process log as seen in Console.App shown launching Spotify
Process and Network Info
There are several plain text files containing readouts of top and ps from the time of collection. This could be valuable in identifying anomalous processes. However, in cases where the process might be named something inconspicuous there limitations in the data to enable the conclusive identification of suspicious processes.
Included in the sysdiagnose collection is a directory of assorted network data; such as ifconfig output, routing, proxy and netstat command output. This data contains some active network connections around the time of collection that could be used to identify suspicious network activity.
There are some limitations, for example linking a connection back to a process or file is not as trivial as it could be. However, there is more valuable networking data that could be collected and used to greatly supplement analysis, which is covered in the following section.
Shortcomings
There are some areas sysdiagnose does not cover that would add value in most incident response investigations. For this reason, we created a collection script that addresses these shortcomings and collects the following:
- Persistence mechanisms, although some launchd data is collected by sysdiagnose there are a lot of other persistence mechanisms we could be collecting for further investigation. A deeper dive into various persistence mechanisms is out of the scope of this blog post, briefly however the collection script currently collects the following:
- LaunchAgents/LaunchDaemons, these are the reminiscent of Windows scheduled tasks and are responsible for launching certain applications and processes at startup. This is a persistence mechanism commonly used by malware that contains a path to the executable or application it is launching as well as some options around launch conditions.
- LoginItems, these are a means of enabling startup of some applications for individual users at login.
- Managed Profiles, it is possible to utilize the means system admins would use to manage devices in order to install malicious profiles on a victim's system. Profiles can manipulate a variety of network settings.
- CronTabs, similar to their usage on other operating systems by threat actors.
- Emond is a event monitoring service Apple added to macOS several versions ago but has remained largely untouched. This service allows a threat actor to monitor for an event and upon that event perform an action, making it a useful but overlooked persistence mechanism.
- Folder actions, AppleScript is a powerful automation scripting language on macOS that can be run upon a folder being edited.
- Periodic are scripts that can run daily, weekly, monthly.
- A login hook can be written using the defaults command pointed at ‘com.apple.loginwindow’ allowing for both login and logout scripts.
- Bash / ZSH data, this includes rc, history, and sessions files. These can come in very useful in identifying any anomalous command line activity.
- lsof is a command that lists open files that also can list network connections from a process. The combination running lsof and lsof -i is an easy to search and verify list of IPs and processes that can be run against threat intelligence sources to identify suspicious activity.
- File System Events (FSEvents). Located at the root of any valid file system mounted to a MacOS system these event logs contain file changes similarly to a Windows USN Journal. The key difference being FSEvents are quite volatile and are often lost whenever a system crash or unexpected shutdown occurs. There are FSEvents that are wrapped into the ‘logarchive’ however the purpose of collecting them here is to include current ones that may not have been rolled up yet.
- A CSV of SHA1s and file metadata for some non-system context files. This is an intensive process to run however once completed it’s possible to do some easy checks using the SHA1s for any files we might want to follow up using various TI sources. Initially this was done only on files with execution permissions however after testing some uses cases this was found to be insufficient. To expand upon this functionality whilst also keeping time to completion reasonable multiple listings are now created filtered additionally around file extensions and areas on the file system.

Reference: A screenshot of the code that handles collecting meta data on each file in a file listing.
- Browser data. The threat landscape for macOS is dominated by phishing, 6 million phishing attacks occurred on macOS users in the first half of 2019 according to securelist[6]. By collecting information from a variety of possible browsers stored on the system we can get an accurate idea if any phishing might have occurred as well as identifying any interesting downloads related to a phishing attack.
- Extended Attribute search. This is a recent addition to the script that might be expanded in future to included more attributes. Using mdfind to identify files that match certain metadata like the extended attribute for a file downloaded using a browser ‘kMDItemWhereFroms’ we can identify any potential results of phishing. Then using xattr read all of the extended attributes for that match and convert the data into hex to be saved into a SQLite3 database. This data can then be read using a tool to read PList files. Extended attributes are not a complete source of truth however, as they can be easily removed or edited.
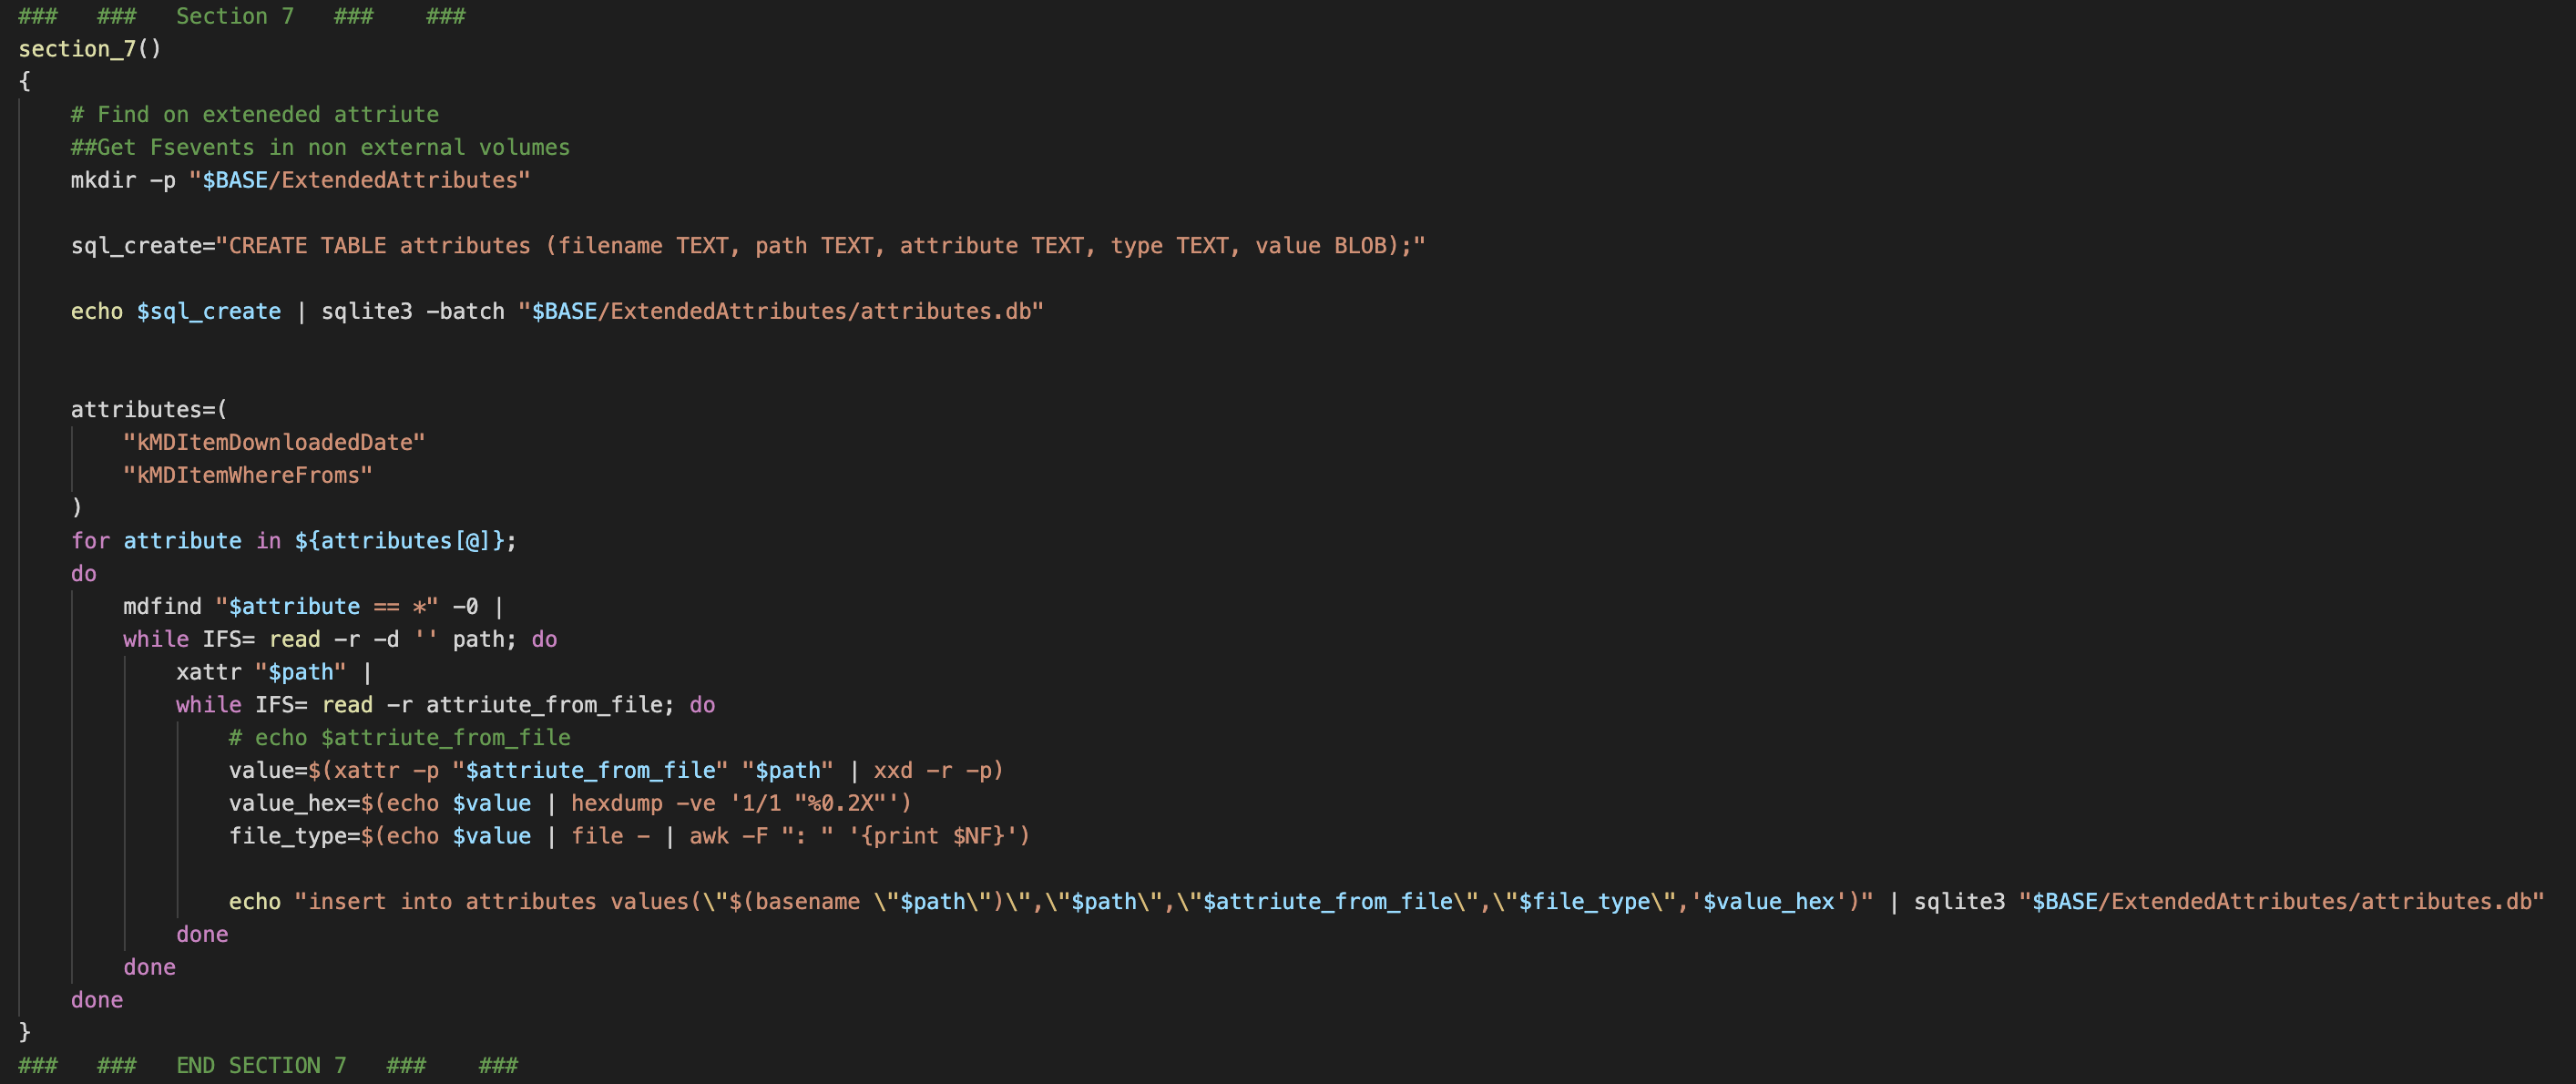
Reference: Screenshot of the code that collects that handles collecting extended attributes
The collection script can be found on our GitHub here!
Real world example
Apfell/Mythic is a cross platform C2 framework[7] with capability on macOS. Setting up an Apfell agent in a virtual machine we can explore some examples of data might be useful from the collection script.
First, checking the ‘logarchive’ for osascript logs, osascript is the command used to run a variety of scripting languages like AppleScript and JavaScript. The Apfell agent can have a variety of payloads, the one selected for this example had a JavaScript payload. The ‘logarchive’ showed osascript running and making network connections every 10 seconds or so. There are also logs indicating successful transfer of data; however, the destination IP of both these logs however is obfuscated.
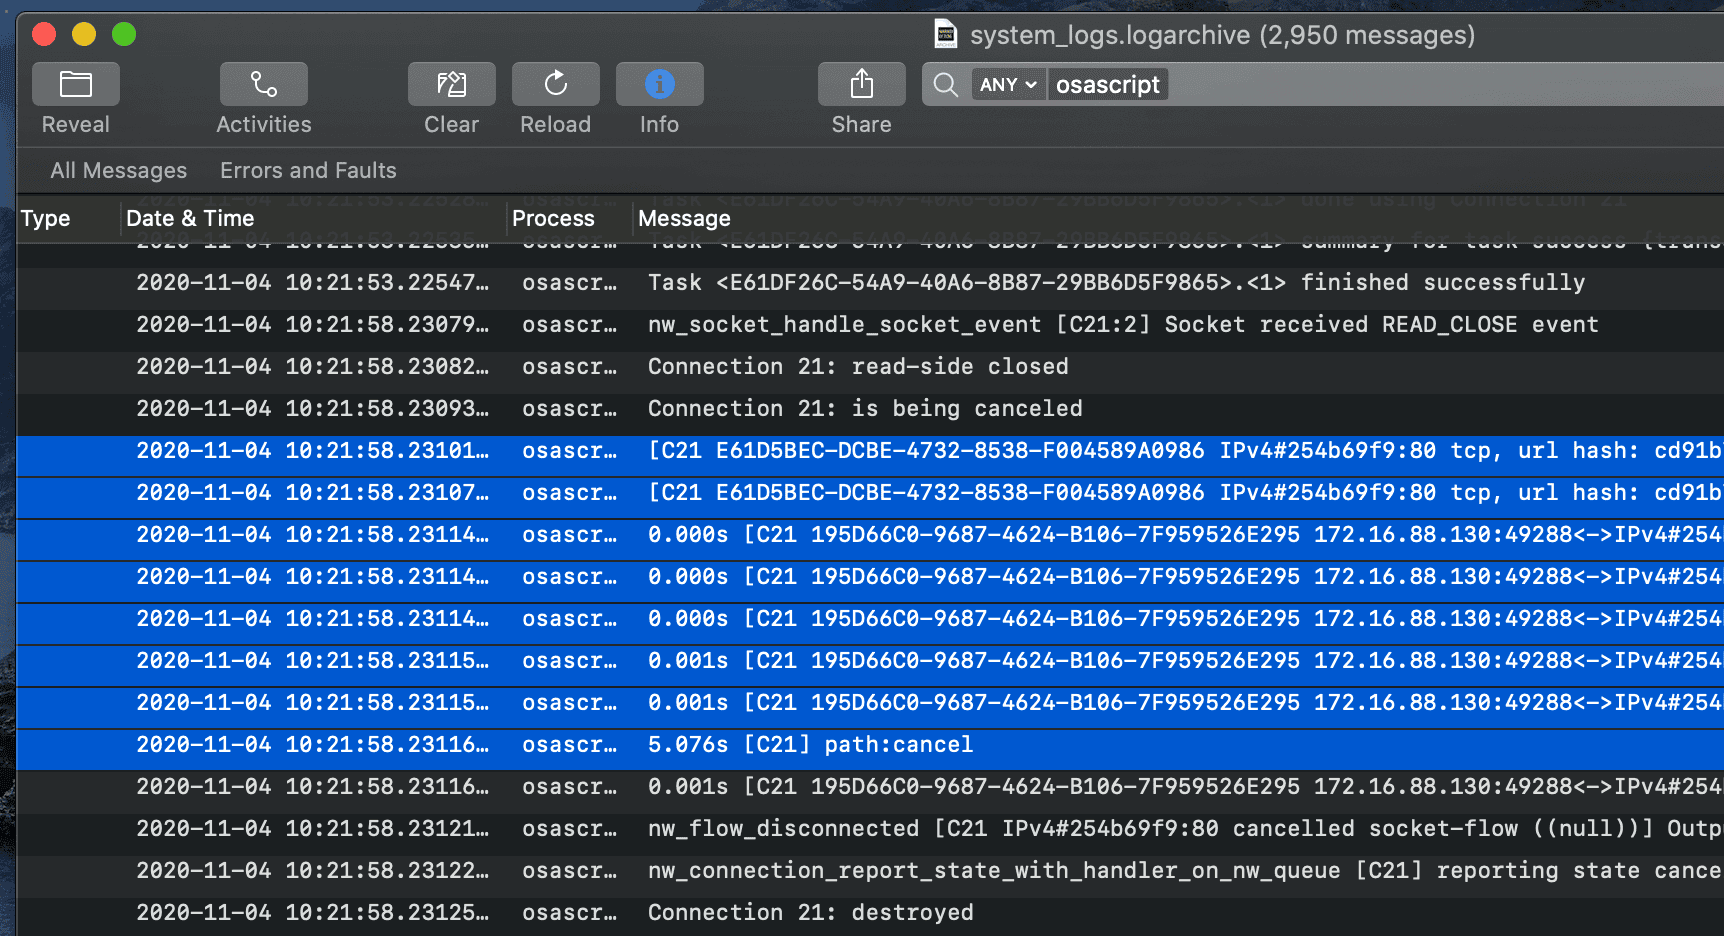
Reference: Highlighted in the screenshot above is a block of logs indicating an established connection to the C2
By searching the data collected we can try to identify the C2 address. Based on the logs above it is possible to identify the victim hosts IP address and the port on the C2 the victims host is connecting to. Running a simple grep over the data for our victims IP and ‘:80’ should provide us with some interesting information. However, this did not return the expected results due to the fact that in netstat output on macOS ports are not denoted by at colon but by a period. The results of a grep on ‘.80’ and our local IP shows matches from the 'WiFi' directory of sysdiagnose output.
./sysdiagnose.../WiFi/netstat-POST.txt: tcp4 0 0 172.16.88.130.51203 172.16.88.134.80 ESTABLISHED
./sysdiagnose.../WiFi/netstat-PRE.txt: tcp4 0 0 172.16.88.130.51203 172.16.88.134.80 ESTABLISHED
Reference: The WiFi directory contains two netstat outputs, netstat -n, showing ‘ESTABLISHED’ connections to the C2 address on port 80.<\p>
Using the C2 address we can identify some further information, because this is a test your mileage may vary, but for demonstration purposes it is possible to identify the URL and how the payload was downloaded. These can been in the ‘History.db’ file and the ‘Downloads.plist’ snippets below.
{
"DownloadHistory" => [
0 => {"DownloadEntryBookmarkBlob" => {length = 756, bytes = 0x626f6f6b f4020000 00000410 30000000 ... 04000000 00000000 }
"DownloadEntryDateAddedKey" => 2020-11-16 10:29:44 +0000
"DownloadEntryDateFinishedKey" => 2020-11-16 10:29:44 +0000
"DownloadEntryIdentifier" => "831B3780-1959-4BC5-978B-FB63AA430C25"
"DownloadEntryPath" => "/Users/test_account/Downloads/apfell.js"
"DownloadEntryProgressBytesSoFar" => 112116
"DownloadEntryProgressTotalToLoad" => 112116
"DownloadEntryRemoveWhenDoneKey" => 0
"DownloadEntryShouldUseRequestURLAsOriginURLIfNecessaryKey" => 0
"DownloadEntryURL" => "http://172.16.88.134:8081/apfell.js"
}
]
}
Reference: The output of plutil -p run against the 'Downloads.plist' from the collected Safari data.
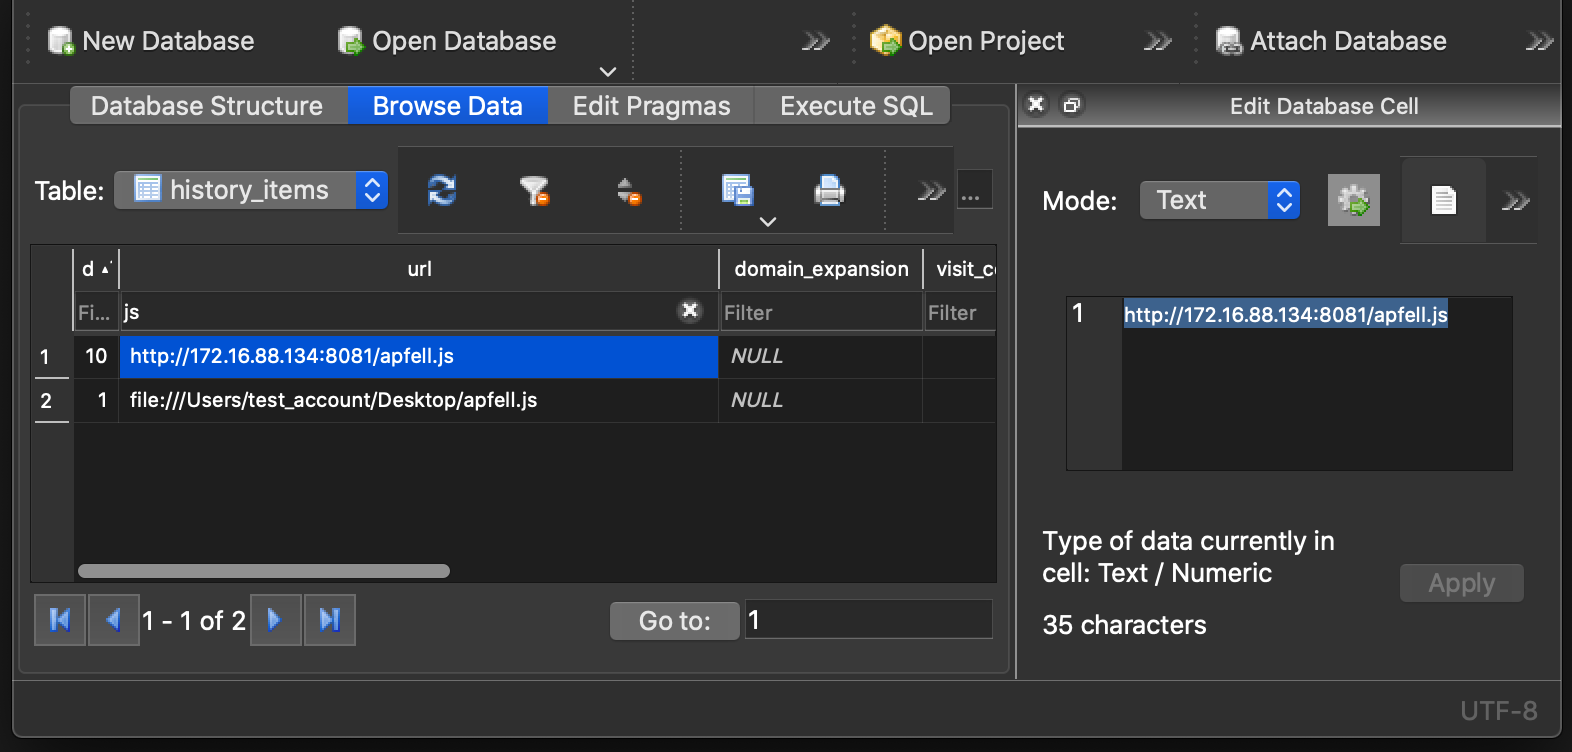
Reference: The 'apfell.js' payload being downloaded by Safari.
Searching on ‘apfell.js’ shows some interesting records in the ps and the bash history output. In ‘ps.txt’ we can see the osascript process running. Similarly, we can see the script being run in the ‘.zsh_history’ file however this will of course not always be the case.
./BashData/.zsh_history:sudo osascript apfell.js
./sysdiagnose.../ps.txt:root 0 2040 2037 0.0 0.2 31 0 4310940 6364 - s001 S+ 10:34AM 0:00.04 sudo osascript apfell.js
Reference: Additional searching in the 'logarchive' data identified the osascript being executed with sudo privileges for the ‘apfell.js’ script.
Testing against this framework highlighted a number of further interesting files worthy of collection. Therefore, support was added for file listings on file extensions and detection of ‘LoginItems’, a persistence mechanism, in the ‘backgrounditems.btm’ file.
Conclusion
Although intended for troubleshooting crashes and diagnosing problems, there are some useful applications of sysdiagnose data in forensic investigations. The inclusion of larger log sources as well as some process and network data make it an excellent tool for gathering triage information. Wrapping sysdiagnose in a collection script with some useful additions results in a comprehensive tool for gathering macOS triage data.
There is room for improvement here, originally the script used MD5s and was then changed to SHA1s but further research could be done in benchmarking which would be more performant. It should be noted the extended attributes collection is not completely stable. This appears to be due to running xattr on certain files located in iCloud, errors for all sections are saved to the '*.errors' files. As understanding and attacker trade-craft continues to be exposed on macOS there is opportunity for further expansion to the collection. It is hoped that the release of this script will be valuable for other blue teams in their investigations and serves as a baseline for further development.
sysdiagnose? More like sysdiag-’the more you knows’.