H-field electromagnetic sniffing
By on 16 September, 2016
Introduction
All cryptographic operations are processes where data elements must be represented by physical quantities in physical structures such as gates and transmission lines. These physical quantities and structures must necessarily have a time and spatial extent.
As a result, a finite amount of energy must be transmitted during operation, necessarily giving rise to an electromagnetic (EM) field. If no provision has been made to sufficiently reduce this leaked EM field, then an EM analysis should uncover, at least partially, the secret information originally transmitted [1-7].
Electromagnetic side-channel analysis is a general term given to attacks that exploit correlations between secret information and EM fields emitted by the device under test (DUT) [2]. Power-analysis techniques can be considered a sub-set of this more general topic. Power analysis techniques rely on the fact that return currents caused by circuit elements connected to a single power supply can, to some extent, be isolated. This is only possible if a time or frequency domain difference between two or more signals is discernible. On the other hand, an EM field analysis not only adds more frequency domain information (voltage regulation circuitry often filters out a large part of the frequency spectrum) but also spatial resolution, therefore transforming our view of the leaked side-channel information from a single dimension to a three-dimensional vector space.
In this work, we present an H-field EM analysis methodology and use it to sniff EM traces of serial data transmitted within a DUT.
This article is organised as follows:
First we demonstrate how an H-field sensor can be constructed using off-the-shelf components. Next, raw data is captured using this setup. Then this data is processed using the proposed methodology and the secret information extracted.
Active H-field sensor
The H-field sensor is constructed using off-the-shelf components as shown below. The shielded-loop antenna is connected to a low-noise amplifier (LNA) with 32 dB of gain and a noise figure of 2.5 dB. The LNA is in turn connected to a universal software radio peripheral (USRP) where the raw data is processed and the leaked EM information extracted. The LNA is powered by a power supply unit (PSU), as indicated.
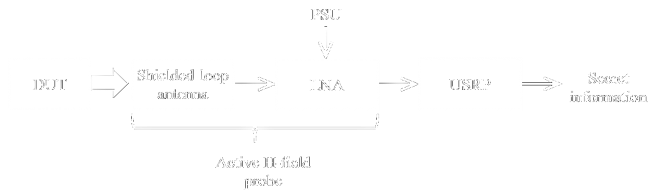
Depending on the choice of the LNA and USRP, this approach can be used to target data rates ranging from a few kHz to hundreds of MHz. The upper data rate is typically limited by the USRP's bandwidth and the shielded-loop antenna dimensions. In this work the aforementioned flow diagram is implemented as shown below.
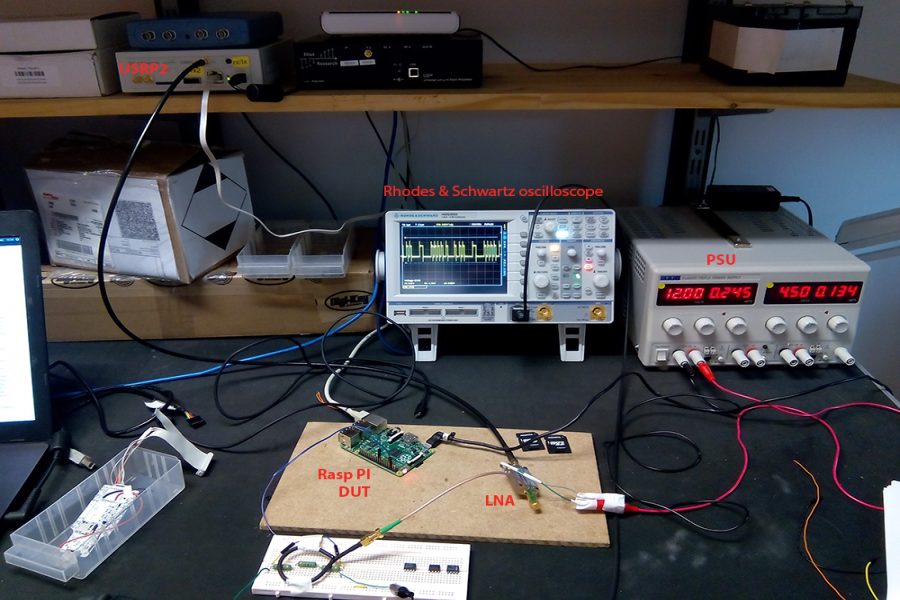
A raspberry Pi is used to simulate the DUT and outputs serial data at 2.5 MHz to a load, in this case a simple resistor. A shielded-loop antenna with a diameter of 5 cm is placed above the serial data carrying wire. A detailed view of the H-field probe is shown below.
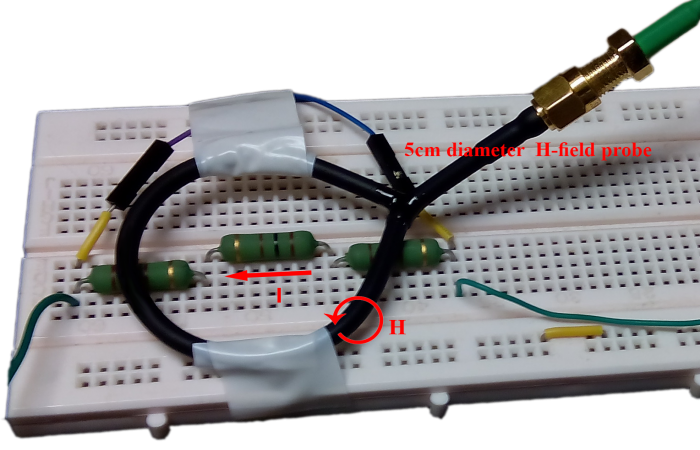
The current flow through the resistive load (I) as well as the induced magnetic-field (H) are shown. The H-field, by Lenz's law, in turn induces a current in the shielded-loop antenna and in effect a differential voltage, which is subsequently amplified by the LNA.
ASCII data is sent through the SPI interface, in the present case representing the secret information, as shown below.
There are 5 houses that have 5 occupants. Each occupants house is differently colored. The houses also have different choice of beverages different cigarette brands and a unique pet. Your goal is to figure out which occupant owns the fish. Here is more information. An Englishman resides in a red house. The Dane drinks tea, Dogs are kept by the Swede. The green house is left to the white house. The occupant of the green house drinks coffee. The birds are kept by the Pall Mall smoker. The Dunhill smoker lives in the yellow house. The milk is drunk by the man living in the center house. The first houses occupant is Norwegian. The blend smokers neighbor keeps cats. The horse keeper and the Dunhill smoker live next to each other. The German smokes Prince. The Norwegian lives right next to the blue house. The blend smokers neighbor drinks water.
Captured data
The active H-field sensor of the previous section is used to capture leaked EM information during transmission of the secret message. At an SPI clock rate of 5 MHz it takes roughly 1.2 ms to transmit this message. The differential voltage induced accross the shielded-loop antenna, after amplification by the LNA and digitization by the USRP, is shown below.
The spectrum of the captured signal is also shown.
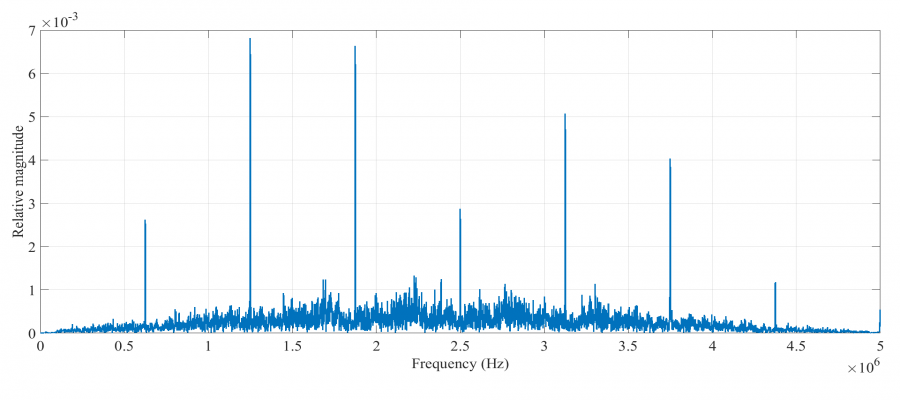
The bandwidth is twice the SPI data rate - which is also the SPI clock rate. The captured data is then post-processed, in order to extract the original secret information, as detailed in the following section.
Mathematical analysis
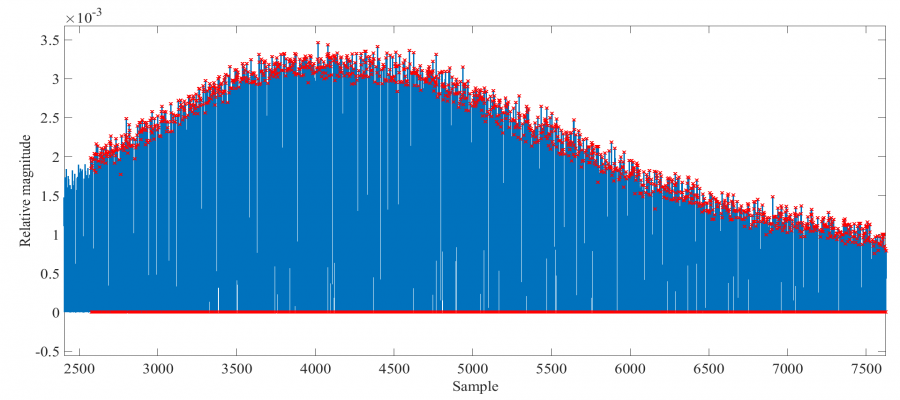
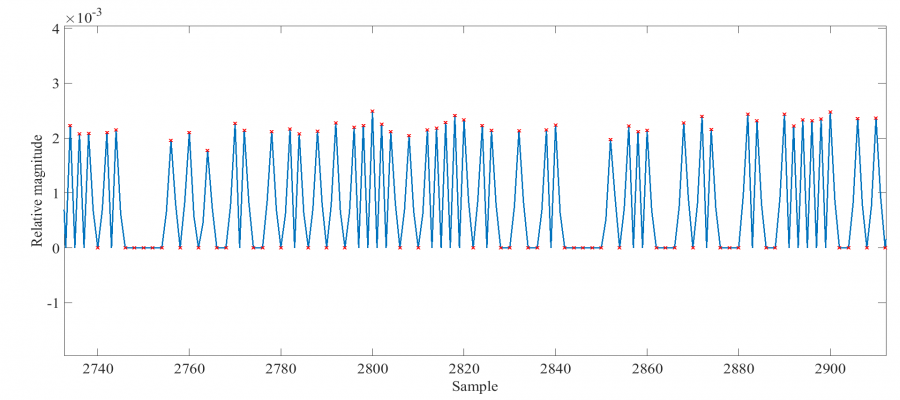
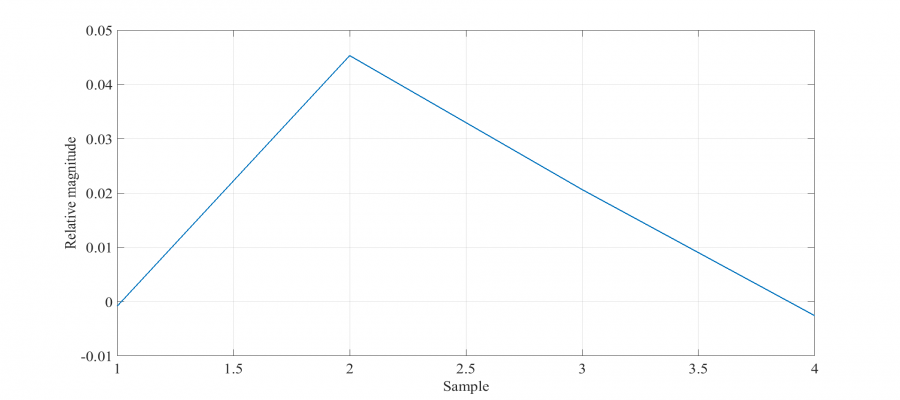
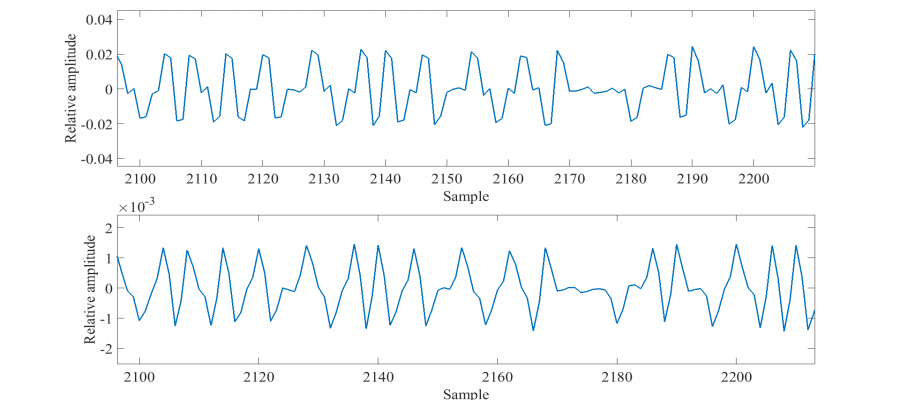
The raw signal is first cross-correlated with an elementary pulse (smallest signal section representing a data point), manually identified and extracted from the captured data as shown below.
This correlation increases the useful signal to noise ration (SNR) by reducing the relative magnitude of higher frequency pulses. The improvement in the present case is only slight, since sources of interference were not significant, as shown below. The first figure shows the captured signal whereas the second one the cross-correlated result. It is evident that the smaller pulses are filtered out.
Next, threshold voltages for logical transitions are determined. An analysis of noise data, in order to set meaningful thresholds, is therefore required. The H-field sensor is moved away from the DUT and other sources of interference, resulting in the following captured noise data.
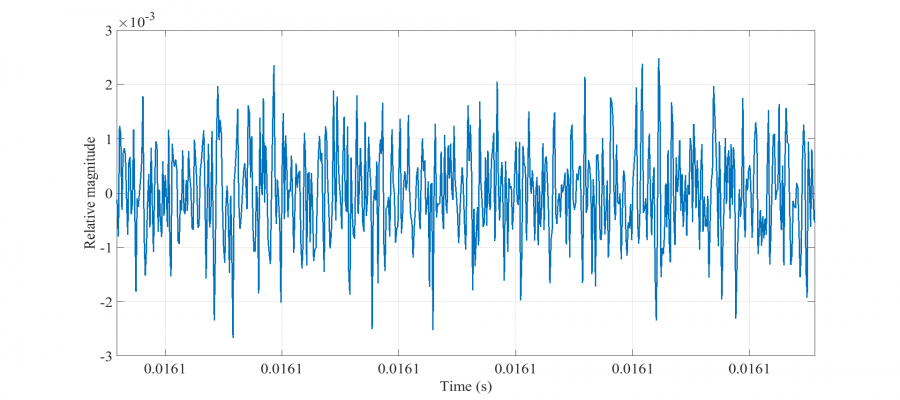
A statistical analysis is then performed resulting in an average noise of 105.5 uV with a standard deviation of 34.4 uV. A similar statistical analysis is also performed on the cross-correlated (captured secret) signal of the previous section in order to quantify the distribution of peak signal (pulse) values. The results are shown below.
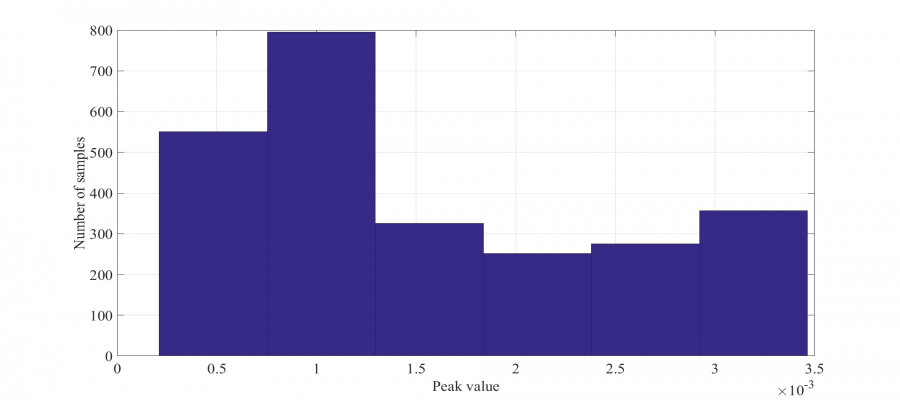
Based on the above, a minimum logic transition value of 128 uV and a confident transition value of 500 uV is chosen. The cross-correlated signal is then sampled at a rate of 2.5 MHz and converted to a digital data stream using the aforementioned transition values. During the analogue to digital conversion process, it is important to keep in mind that the shielded-loop antenna acts as a differentiator. Therefore, the signal transitions (low-to-high or high-to-low) represent digital 1's and 0's and not the absolute peak values. Depending on the position of the H-field antenna as well as the direction of current flow in the DUT, a digital 1 will be represented by either a positive or negative transition, giving way to two possible data stream interpretations. Additionally, an assumption as to the initial binary value has to be made, adding a further two possibilities. Furthermore, since the captured signal is sampled at a randomly chosen starting point, possibly in the middle of a frame, there are frame length number of possible interpretations.
The total number of possible data interpretations is therefore: 4xframe_length.
In the present case, since ASCII data is transmitted with no parity or stop bits, this frame length is 8. Therefore, a total of 32 possible interpretations exist, two of which are shown below.
½ÕÈ ½° ¥Ì Ѽ ¥ ÕÉ ½ÕÐ Ý¡¥@~BrqÕÁ¹¡xr17âä1oÉ#?FQ³OÍs Z »ó1Í°zZ{Ýãüñ$dKæÐÛ=#~6j2EÌ ¥¸ É ¡½ÕÍ Q¡ ¹ É¥¹Ì Ñ° ½ Ì É ÁÐ ä Ñ¡ MÝ Q¡ ɸ ¡½ÕÍ ¥Ì ±Ð Ѽ Ñ¡ Ý¡¥Ñ ¡½ÕÍ Q¡ ½ ÕÁ¹Ð ½ Ñ¡ ɸ ¡½ÕÍ É¥¹Ì ½ Q¡ ¥ÉÌ É ÁÐ ä Ñ¡ A±° 5±° ͵½È Q¡ Õ¹¡¥±° ͵½È ±¥ÙÌ ¥¸ Ñ¡ å±±½Ü ¡½ÕÍ Q¡ µ¥±¬ ¥Ì ÉÕ¹¬ ä Ñ¡ µ¸ ±¥Ù¥¹ ¥¸ Ñ¡ ¹ÑÈ ¡½ÕÍ Q¡ ¥ÉÍÐ ¡½ÕÍÌ ½ ÕÁ¹Ð ¥Ì 9½ÉÝ ¥¸ Q¡ ±¹ ͵½ÉÌ ¹¥ ¡½È ÁÌ ÑÌ Q¡ ¡½ÉÍ ÁÈ ¹ Ñ¡ Õ¹¡¥±° ͵½È ±¥Ù ¹áРѼ ½Ñ¡È Q¡ ɵ¸ ͵½Ì AÉ¥¹ Q¡ 9½ÉÝ ¥¸ ±¥ÙÌ É¥ ¡Ð ¹áРѼ Ñ¡ ±Õ ¡½ÕÍ Q¡ ±¹
º¹3·°¶4¹ :7 34³º¹2 7ºº;´4±ÈÈNN:¸0·4 oF&ü\-ù$cGàHÊ6iù®dPs·~f9¶KO{¡àÜã~$s\Úg¤oÆÍFH²2¹ 4·0 92²47º¹² 42 "0·2 294·5¹ :2°"7³¹ 0¹2 5²¸:1< :42 )»²²2 42 3¹2²·47º¹² 4¹ 62³::7 :42 ;´4º2 47º¹² 42 7±±º¸0·:7³:42 3¹2²·47º¹² 294·5¹ 1·³32² 42 14¹29 0¹2 5²¸:1< :42 (0¶6&°¶69¶·µ²¹42 ":·44¶69¶·µ²¹64»2¹ 4·:42 <²¶67» 47º¹² 42 6´¶5 4¹ 29:·5 1< :42 6°·64»4·3 4·:42 1²·:2¹47º¹² 42 34¹9º47º¹²¹ 7±±º¸0·:4¹ '7¹;²³´°·42 162·29¶·µ²¹9 72´³´17¹5²²¸9 1°º9 42 47¹9² 5²²¸2¹0·2:42 ":·44¶69¶·µ²¹64»2 72¼::7 2°±´7º42¹42 #²¹6°·9¶·µ²¹ (94·1² 42 '7¹;²³´°·64»2¹ 94³´:72¼::7 :42 16:² 47º¹² 42 162·2
The interpretation corresponding to the original secret message is identified as:
ish Here is more information. An Englishman resides in a red house. The Dane dri~ks tea, Dogs ar} kept by the Swede he greeàhuse is le~t to the white house. The occõpant of the green house drinks coffee. The birds are kept by the Pall Mall smoker. The Dunhill smoker lives in the yellow house. The milk is drunk by the man living in the center house. The first houses occupant is Norwegian. The blend smokers neighbor keeps cats. The horse keeper and the Dunhill smoker live next to each other. The German smokes Prince. The Norwegian lives right next to the blue house. The blend smokers neighbor drinks waterThere are 5 houses that
Conclusion
It has been demonstrated that using existing off-the-shelf technology and the proposed methodology, EM side-channel attacks can successfully be employed to sniff secret information in underlying hardware. Typically, at this low level of abstraction, a region where sensitive data is typically not encrypted can often be found. The additional introspection made possible with this technique allows for more sophisticated attacks, which were previously not possible due to limited output data made available via traditional channels. One downfall of this method is that spatial resolution is poor (on the order of tens of cm) and as a result information from data lines in close proximity will appear superimposed. Due to the phenomenon of constructive and destructive interference, information will inevitably (at the same frequency) be lost. Future work will aim at adding another two degrees of freedom and thus transforming the problem into a four- or five-dimensional vector space by incorporating electronically steerable two-dimensional spatial filtering with resolution of roughly 100 microns.
References
[1] Gandolfi, Karine, Christophe Mourtel, and Francis Olivier. "Electromagnetic analysis: Concrete results." International Workshop on Cryptographic Hardware and Embedded Systems. Springer Berlin Heidelberg, 2001.
[2] Agrawal, D., et al. "The EM side-channel (s): attacks and assessment methodologies,” 2002." (2012): 167-174.
[3] Kuhn, Markus G., and Ross J. Anderson. "Soft tempest: Hidden data transmission using electromagnetic emanations." International Workshop on Information Hiding. Springer Berlin Heidelberg, 1998.
[4] Kraz, Vladimir. "Near-field methods of locating EMI sources." RF EXPO WEST. 1995.
[5] Barenghi, Alessandro, Gerardo Pelosi, and Yannick Teglia. "Information leakage discovery techniques to enhance secure chip design." IFIP International Workshop on Information Security Theory and Practices. Springer Berlin Heidelberg, 2011.
[6] Vuagnoux, Martin, and Sylvain Pasini. "Compromising Electromagnetic Emanations of Wired and Wireless Keyboards." USENIX security symposium. 2009.
[7] Kuhn, Markus G. "Electromagnetic eavesdropping risks of flat-panel displays." International Workshop on Privacy Enhancing Technologies. Springer Berlin Heidelberg, 2004.